Answer: Modeling Data The data in the table show the yield (in milligrams) of a chemical
Chapter 13, Problem 76(choose chapter or problem)
Modeling Data The data in the table show the yield y (in milligrams) of a chemical reaction after t minutes.

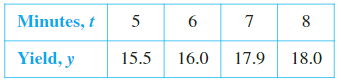
(a) Use the regression capabilities of a graphing utility to find the least squares regression line for the data. Then use the graphing utility to plot the data and graph the model.
(b) Use a graphing utility to plot the points (In t, y). Do these points appear to follow a linear pattern more closely than the plot of the given data in part (a)?
(c) Use the regression capabilities of a graphing utility to find the least squares regression line for the points (In t, y) and obtain the logarithmic model y = a + b In t.
(d) Use a graphing utility to plot the data and graph the linear and logarithmic models. Which is a better model? Explain.
Unfortunately, we don't have that question answered yet. But you can get it answered in just 5 hours by Logging in or Becoming a subscriber.
Becoming a subscriber
Or look for another answer