Solution Found!
?The graph of the acceleration \(a(t)\) of a car, measured in \(\mathrm{ft} /
Chapter 7, Problem 35(choose chapter or problem)
QUESTION:
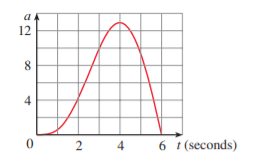
The graph of the acceleration \(a(t)\) of a car, measured in \(\mathrm{ft} / \mathrm{s}^{2}\), is shown. Use Simpson's Rule to estimate the increase in the velocity of the car during the 6 -second time interval.
Equation Transcription:
Text Transcription:
a(t)
ft/s^2
Questions & Answers
QUESTION:
The graph of the acceleration \(a(t)\) of a car, measured in \(\mathrm{ft} / \mathrm{s}^{2}\), is shown. Use Simpson's Rule to estimate the increase in the velocity of the car during the 6 -second time interval.
Equation Transcription:
Text Transcription:
a(t)
ft/s^2
ANSWER:Step 1 of 3
The given graph is
