Solution Found!
Solved: Income Distribution The following data represent
Chapter 8, Problem 10RE(choose chapter or problem)
Income Distribution The following data represent the percentage of total adjusted gross income (AGI) earned by various income classes. Tire top 1% represents the percentage of total AGI earned by those whose income is higher than 99% of all earners. The bottom 50% represents the percentage of total AGI earned by those whose income is in the bottom 50% of all income earners. For example, in 2001,17.53% of all income earned in the United States was earned by those in the top 1% of all income earners, while 13.81% of all income earned in the United States was earned by those in the bottom 50% of income earners.
(a) Use the data to make a strong argument that adjusted gross incomes are diverging among Americans.
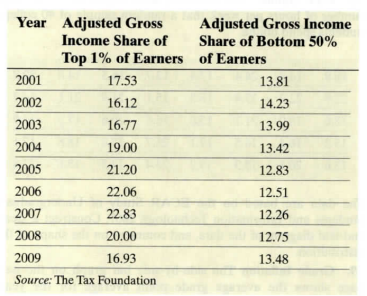
The following data represent the percentage of total tax paid by the top 1 % of all income earners and the bottom 50% of all income earners.
(b) Use the data to make an argument that, while incomes are diverging between the top 1 % and bottom 50%, the total taxes paid as a share of income are also diverging.

Questions & Answers
QUESTION:
Income Distribution The following data represent the percentage of total adjusted gross income (AGI) earned by various income classes. Tire top 1% represents the percentage of total AGI earned by those whose income is higher than 99% of all earners. The bottom 50% represents the percentage of total AGI earned by those whose income is in the bottom 50% of all income earners. For example, in 2001,17.53% of all income earned in the United States was earned by those in the top 1% of all income earners, while 13.81% of all income earned in the United States was earned by those in the bottom 50% of income earners.
(a) Use the data to make a strong argument that adjusted gross incomes are diverging among Americans.
The following data represent the percentage of total tax paid by the top 1 % of all income earners and the bottom 50% of all income earners.
(b) Use the data to make an argument that, while incomes are diverging between the top 1 % and bottom 50%, the total taxes paid as a share of income are also diverging.
ANSWER:
Answer :
Step 1 of 2 :
Given, The following data represent the percentage of total tax paid by the top 1 % of all income earners and the bottom 50% of all income earners.
year |
Top 1% |
Bottom 50% |
Difference in percentage |
2001 |
17.53 |
13.81 |
3.72 |
2002 |
16.12 |
14.23 |
1.89 |
2003 |
16.77 |
13.99 |
2.78 |
2004 |
19 |
13.42 |
5.58 |
2005 |
21.2 |
12.83 |
8.37 |
2006 |
22.06 |