Solution Found!
Sanitation inspection of cruise ships. To minimize the
Chapter , Problem 24E(choose chapter or problem)
To minimize the potential for gastrointestinal disease outbreaks, all passenger cruise ships arriving at U.S. ports are subject to unannounced sanitation inspections. Ships are rated on a 100-point scale by the Centers for Disease Control and Prevention. A score of 86 or higher indicates that the ship is providing an accepted standard of sanitation. The latest (as of Jan. 2010) sanitation scores for 186 cruise ships are saved in the accompanying file. The first five and last five observations in the data set are listed in the following table:

Source: Data from U.S. Department of Health and Human Services, Centers for Disease Control and Prevention/National Center for Environmental Health and Agency for Toxic Substances and Disease Registry, January 6, 2010.
a. Generate a stem-and-leaf display of the data. Identify the stems and leaves of the graph.
b. Use the graphs to estimate the proportion of ships that have an accepted sanitation standard. Which graph did you use?
c. Locate the inspection score of 69 (Albatross) on the stem-and-leaf display.
Questions & Answers
(1 Reviews)
QUESTION:
To minimize the potential for gastrointestinal disease outbreaks, all passenger cruise ships arriving at U.S. ports are subject to unannounced sanitation inspections. Ships are rated on a 100-point scale by the Centers for Disease Control and Prevention. A score of 86 or higher indicates that the ship is providing an accepted standard of sanitation. The latest (as of Jan. 2010) sanitation scores for 186 cruise ships are saved in the accompanying file. The first five and last five observations in the data set are listed in the following table:
Source: Data from U.S. Department of Health and Human Services, Centers for Disease Control and Prevention/National Center for Environmental Health and Agency for Toxic Substances and Disease Registry, January 6, 2010.
a. Generate a stem-and-leaf display of the data. Identify the stems and leaves of the graph.
b. Use the graphs to estimate the proportion of ships that have an accepted sanitation standard. Which graph did you use?
c. Locate the inspection score of 69 (Albatross) on the stem-and-leaf display.
ANSWER:Step 1 of 3
a)
Using a MINITAB, stem-and-leaf display of the data
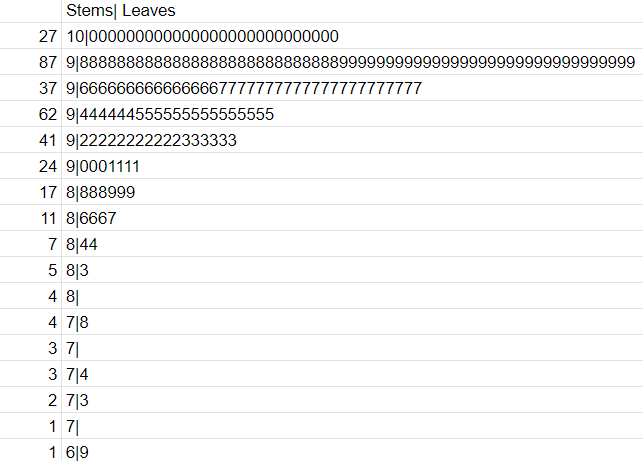
Where 8|4 = 84, and the left side of the line depicts the stem, and the right side depicts the leaf of the stem and leaf diagram.
Reviews
Review this written solution for 39528) viewed: 537 isbn: 9780321826237 | Statistics For Business And Economics - 12 Edition - Chapter 2 - Problem 24e
Thank you for your recent purchase on StudySoup. We invite you to provide a review below, and help us create a better product.
No thanks, I don't want to help other students