Solution Found!
The Minitab printout below resulted from fitting the
Chapter 12, Problem 68E(choose chapter or problem)
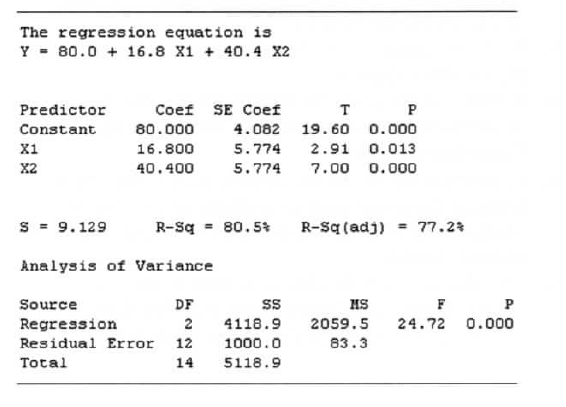
The Minitab printout below resulted from fitting the following model to n = 15 data points:
\(y=\beta_{0}+\beta_{1} x_{1}+\beta_{2} x_{2}+\varepsilon\)
where
\(x_{1}=\left\{\begin{array}{ll} 1 & \text { if level } 2 \\ 0 & \text { if not } \end{array} \quad x_{2}=\left\{\begin{array}{l} 1 \text { if level } 3 \\ 0 \text { if not } \end{array}\right.\right.\)
a. Report the least squares prediction equation.
b. Interpret the values of \(\beta_1\) and \(\beta_2\).
c. Interpret the following hypotheses in terms of \(\mu_1\), \(\mu_2\),and \(\mu_3\):
\(H_0:\ \beta_1=\beta_2=0\)
\(H_a\): At least one of the parameters \(\beta_1\) and \(\beta_2\) differs from 0
d. Conduct the hypothesis test of part c.
Questions & Answers
QUESTION:
The Minitab printout below resulted from fitting the following model to n = 15 data points:
\(y=\beta_{0}+\beta_{1} x_{1}+\beta_{2} x_{2}+\varepsilon\)
where
\(x_{1}=\left\{\begin{array}{ll} 1 & \text { if level } 2 \\ 0 & \text { if not } \end{array} \quad x_{2}=\left\{\begin{array}{l} 1 \text { if level } 3 \\ 0 \text { if not } \end{array}\right.\right.\)
a. Report the least squares prediction equation.
b. Interpret the values of \(\beta_1\) and \(\beta_2\).
c. Interpret the following hypotheses in terms of \(\mu_1\), \(\mu_2\),and \(\mu_3\):
\(H_0:\ \beta_1=\beta_2=0\)
\(H_a\): At least one of the parameters \(\beta_1\) and \(\beta_2\) differs from 0
d. Conduct the hypothesis test of part c.
ANSWER:Step 1 of 5
For a single qualitative variable, we have the model 
Where,

Sample number of points n = l5