Construct a truth table for the given statement. \(p \rightarrow \sim q\)
Read moreTable of Contents
Chapter 5
Number Theory and the Real Number System
1
Problem Solving and Critical Thinking
1.1
Inductive and Deductive Reasoning
1.2
Estimation, Graphs, and Mathematical Models
1.3
Problem Solving
2
Set Theory
2.1
Basic Set Concepts
2.2
Subsets
2.3
Venn Diagrams and Set Operations
2.4
Set Operations and Venn Diagrams with Three Sets
2.5
Survey Problems
3
Logic
3.1
Statements, Negations, and Quantified Statements
3.2
Compound Statements and Connectives
3.3
Truth Tables for Negation, Conjunction, and Disjunction
3.4
Truth Tables for the Conditional and the Biconditional
3.5
Equivalent Statements and Variations of Conditional Statements
3.6
Negations of Conditional Statements and De Morgans Laws
3.7
Arguments and Truth Tables
3.8
Arguments and Euler Diagrams
4
Number ,Representation and Calculation 211
4.1
Our Hindu-Arabic System and Early Positional Systems
4.2
Number Bases in Positional Systems
4.3
Computation in Positional Systems
4.4
Looking Back at Early Numeration Systems
5
Number Theory and the Real Number System
5.1
Number Theory: Prime and Composite Numbers
5.2
The Integers; Order of Operations
5.3
The Rational Numbers
5.4
The Irrational Numbers
5.5
Real Numbers and Their Properties; Clock Addition
5.6
Exponents and Scientific Notation
5.7
Arithmetic and Geometric Sequences
6
Algebra: Equations and Inequalities
6.1
Algebraic Expressions and Formulas
6.2
Linear Equations in One Variable and Proportions
6.3
Applications of Linear Equations
6.4
Linear Inequalities in One Variable
6.5
Quadratic Equations
7
Algebra:Graphs, Functions, and Linear Systems
7.1
Graphing and Functions
7.2
Linear Functions and Their Graphs
7.3
Systems of Linear Equations in Two Variables
7.4
Linear Inequalities in Two Variables
7.5
Linear Programming
7.6
Modeling Data: Exponential, Logarithmic, and Quadratic Functions
8
Personal Finance
8.1
Percent, Sales Tax, and Discounts
8.2
Income Tax
8.3
Simple Interest
8.4
Compound Interest
8.5
Annuities, Methods of Saving, and Investments
8.6
Cars
8.7
The Cost of Home Ownership
8.8
Credit Cards
9
Measurements
9.1
Measuring Length; The Metric System
9.2
Measuring Area and Volume
9.3
Measuring Weight and Temperature
10
Geometry
10.1
Points, Lines, Planes, and Angles
10.2
Triangles
10.3
Polygons, Perimeter, and Tessellations
10.4
Area and Circumference
10.5
Volume and Surface Area
10.6
Right Triangle Trigonometry
10.7
Beyond Euclidean Geometry
11
Counting Methods and Probability Theory
11.1
The Fundamental Counting Principle
11.2
Permutations
11.3
Combinations
11.4
Fundamentals of Probability
11.5
Probability with the Fundamental Counting Principle, Permutations, and Combinations
11.6
Events Involving Not and Or; Odds
11.7
Events Involving And; Conditional Probability
11.8
Expected Value
12
Statistics
12.1
Sampling, Frequency Distributions, and Graphs
12.2
Measures of Central Tendency
12.3
Measures of Dispersion
12.4
The Normal Distribution
12.5
Problem Solving with the Normal Distribution
12.6
Scatter Plots, Correlation, and Regression Lines
13
Voting and Apportionment
13.1
Voting Methods
13.2
Flaws of Voting Methods
13.3
Apportionment Methods
13.4
Flaws of Apportionment Methods
14
Graph Theory
14.1
Graphs, Paths, and Circuits
14.2
Euler Paths and Euler Circuits
14.3
Hamilton Paths and Hamilton Circuits
14.4
Trees
Textbook Solutions for Thinking Mathematically
Chapter 3.4 Problem 84
Question
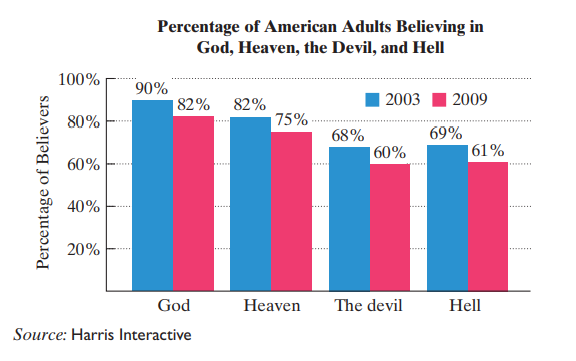
The bar graph shows the percentage of American adults who believed in God, Heaven, the devil, and Hell in 2009 compared with 2003.
Write each statement in symbolic form. (Increases or decreases in each simple statement refer to 2009 compared with 2003.) Then use the information in the graph to determine the truth value of each compound statement.
If there was a decrease in the percentage who believed in God, then it is not the case that there was an increase in the percentage who believed in the devil or in Hell.
Solution
The first step in solving 3.4 problem number 84 trying to solve the problem we have to refer to the textbook question: The bar graph shows the percentage of American adults who believed in God, Heaven, the devil, and Hell in 2009 compared with 2003.Write each statement in symbolic form. (Increases or decreases in each simple statement refer to 2009 compared with 2003.) Then use the information in the graph to determine the truth value of each compound statement.If there was a decrease in the percentage who believed in God, then it is not the case that there was an increase in the percentage who believed in the devil or in Hell.
From the textbook chapter Truth Tables for the Conditional and the Biconditional you will find a few key concepts needed to solve this.
Visible to paid subscribers only
Step 3 of 7)Visible to paid subscribers only
Subscribe to view the
full solution
full solution
Title
Thinking Mathematically 6
Author
Robert F. Blitzer
ISBN
9780321867322
The bar graph shows the percentage of American adults who
Chapter 3.4 textbook questions
-
Chapter 3: Problem 1 Thinking Mathematically 6
-
Chapter 3: Problem 2 Thinking Mathematically 6
Construct a truth table for the given statement. \(\sim p \rightarrow q\)
Read more -
Chapter 3: Problem 3 Thinking Mathematically 6
Construct a truth table for the given statement. \(\sim(q \rightarrow p)\)
Read more -
Chapter 3: Problem 4 Thinking Mathematically 6
In Exercises 1–16, construct a truth table for the given statement. \(\sim(p \rightarrow q)\)
Read more -
Chapter 3: Problem 5 Thinking Mathematically 6
Construct a truth table for the given statement. \((p \wedge q) \rightarrow(p \vee q)\) Text Transcription: (p wedge q) rightarrow(p vee q)
Read more -
Chapter 3: Problem 6 Thinking Mathematically 6
Construct a truth table for the given statement. \((p \vee q) \rightarrow(p \wedge q)\)
Read more -
Chapter 3: Problem 7 Thinking Mathematically 6
Construct a truth table for the given statement. \((p \rightarrow q) \wedge \sim q\) Text Transcription: (p rightarrow q) wedge sim q
Read more -
Chapter 3: Problem 8 Thinking Mathematically 6
Construct a truth table for the given statement. \((p \rightarrow q) \wedge \sim p\) Text Transcription: (p rightarrow q) wedge sim p
Read more -
Chapter 3: Problem 9 Thinking Mathematically 6
Construct a truth table for the given statement. \((p \vee q) \rightarrow r\)
Read more -
Chapter 3: Problem 10 Thinking Mathematically 6
Construct a truth table for the given statement. \(p \rightarrow(q \vee r)\) Text Transcription: p rightarrow(q vee r)
Read more -
Chapter 3: Problem 11 Thinking Mathematically 6
Construct a truth table for the given statement. \(r \rightarrow(p \wedge q)\) Text Transcription: r rightarrow(p wedge q
Read more -
Chapter 3: Problem 12 Thinking Mathematically 6
In Exercises 1–16, construct a truth table for the given statement. \(r \rightarrow(p \vee q)\)
Read more -
Chapter 3: Problem 13 Thinking Mathematically 6
Construct a truth table for the given statement. \(\sim r \wedge(\sim q \rightarrow p)\) Text Transcription: sim r wedge(sim q rightarrow p)
Read more -
Chapter 3: Problem 14 Thinking Mathematically 6
Construct a truth table for the given statement. \(\sim r \wedge(q \rightarrow \sim p)\) Text Transcription: sim r wedge(q rightarrow sim p)
Read more -
Chapter 3: Problem 15 Thinking Mathematically 6
Construct a truth table for the given statement. \(\sim(p \wedge r) \rightarrow(\sim q \vee r)\) Text Transcription: sim(p wedge r) rightarrow (sim q vee r)
Read more -
Chapter 3: Problem 16 Thinking Mathematically 6
In Exercises 1–16, construct a truth table for the given statement. \(\sim(p \vee r) \rightarrow(\sim q \wedge r)\)
Read more -
Chapter 3: Problem 17 Thinking Mathematically 6
Construct a truth table for the given statement. \(p \leftrightarrow \sim q\) Text Transcription: p leftrightarrow sim q
Read more -
Chapter 3: Problem 18 Thinking Mathematically 6
Construct a truth table for the given statement. \(\sim p \leftrightarrow q\) Text Transcription: sim p leftrightarrow q
Read more -
Chapter 3: Problem 19 Thinking Mathematically 6
Construct a truth table for the given statement. \(\sim(p \leftrightarrow q)\) Text Transcription: sim(p leftrightarrow q)
Read more -
Chapter 3: Problem 20 Thinking Mathematically 6
Construct a truth table for the given statement. \(\sim(q \leftrightarrow p)\)
Read more -
Chapter 3: Problem 21 Thinking Mathematically 6
Construct a truth table for the given statement. \((p \leftrightarrow q) \rightarrow p\) Text Transcription: (p leftrightarrow q) rightarrow p
Read more -
Chapter 3: Problem 22 Thinking Mathematically 6
Construct a truth table for the given statement. \((p \leftrightarrow q) \rightarrow q\) Text Transcription: (p leftrightarrow q) rightarrow q
Read more -
Chapter 3: Problem 23 Thinking Mathematically 6
Construct a truth table for the given statement. \((\sim p \leftrightarrow q) \rightarrow(\sim p \rightarrow q)\) Text Transcription: (sim p leftrightarrow q) rightarrow (sim p rightarrow q)
Read more -
Chapter 3: Problem 24 Thinking Mathematically 6
Construct a truth table for the given statement. \((p \leftrightarrow \sim q) \rightarrow(q \rightarrow \sim p)\) Text Transcription: (p leftrightarrow sim q) rightarrow(q rightarrow sim p)
Read more -
Chapter 3: Problem 25 Thinking Mathematically 6
Construct a truth table for the given statement. \([(p \wedge q) \wedge(q \rightarrow p)] \leftrightarrow(p \wedge q)\) Text Transcription: [(p wedge q) wedge(q rightarrow p)] leftrightarrow(p wedge q)
Read more -
Chapter 3: Problem 26 Thinking Mathematically 6
Construct a truth table for the given statement. \([(p \rightarrow q) \vee(p \wedge \sim p)] \leftrightarrow(\sim q \rightarrow \sim p)\) Text Transcription: [(p rightarrow q) vee(p wedge sim p)] leftrightarrow (sim q rightarrow sim p)
Read more -
Chapter 3: Problem 27 Thinking Mathematically 6
Construct a truth table for the given statement. \((p \leftrightarrow q) \rightarrow \sim r\) Text Transcription: (p leftrightarrow q) rightarrow sim r
Read more -
Chapter 3: Problem 28 Thinking Mathematically 6
In Exercises 17–32, construct a truth table for the given statement. \((p \rightarrow q) \leftrightarrow \sim r\)
Read more -
Chapter 3: Problem 29 Thinking Mathematically 6
Construct a truth table for the given statement. \((p \wedge r) \leftrightarrow \sim(q \vee r)\) Text Transcription: (p wedge r) leftrightarrow sim(q vee r)
Read more -
Chapter 3: Problem 30 Thinking Mathematically 6
Construct a truth table for the given statement. \((p \vee r) \leftrightarrow \sim(q \wedge r)\) Text Transcription: (p vee r) leftrightarrow sim(q wedge r)
Read more -
Chapter 3: Problem 31 Thinking Mathematically 6
Construct a truth table for the given statement. \([r \vee(\sim q \wedge p)] \leftrightarrow \sim p\) Text Transcription: [r vee(sim q wedge p)] leftrightarrow sim p
Read more -
Chapter 3: Problem 32 Thinking Mathematically 6
Construct a truth table for the given statement. \([r \wedge(q \vee \sim p)] \leftrightarrow \sim q\) Text Transcription: [r wedge(q vee sim p)] leftrightarrow sim q
Read more -
Chapter 3: Problem 33 Thinking Mathematically 6
Use a truth table to determine whether each statement is a tautology, a self-contradiction, or neither. \([(p \rightarrow q)\land q]\rightarrow p\)
Read more -
Chapter 3: Problem 34 Thinking Mathematically 6
Use a truth table to determine whether each statement is a tautology, a self-contradiction, or neither. \([(p \rightarrow q) \wedge p] \rightarrow q\) Text Transcription: [(p rightarrow q) wedge p] rightarrow qa
Read more -
Chapter 3: Problem 35 Thinking Mathematically 6
Use a truth table to determine whether each statement is a tautology, a self-contradiction, or neither. \([(p \rightarrow q) \wedge \sim q] \rightarrow \sim p\) Text Transcription: [(p rightarrow q) wedge sim q] rightarrow sim p
Read more -
Chapter 3: Problem 36 Thinking Mathematically 6
Use a truth table to determine whether each statement is a tautology, a self-contradiction, or neither. \([(p \rightarrow q) \wedge \sim p] \rightarrow \sim q\) Text Transcription: [(p rightarrow q) wedge sim p] rightarrow sim q
Read more -
Chapter 3: Problem 37 Thinking Mathematically 6
Use a truth table to determine whether each statement is a tautology, a self-contradiction, or neither. \([(p \vee q) \wedge p] \rightarrow \sim q\) Text Transcription: [(p vee q) wedge p] rightarrow sim q
Read more -
Chapter 3: Problem 38 Thinking Mathematically 6
Use a truth table to determine whether each statement is a tautology, a self-contradiction, or neither. \([(p \vee q) \wedge \sim q] \rightarrow p\) Text Transcription: [(p vee q) wedge sim q] rightarrow p
Read more -
Chapter 3: Problem 39 Thinking Mathematically 6
In Exercises 33–56, use a truth table to determine whether each statement is a tautology, a self-contradiction, or neither. \((p \rightarrow q) \rightarrow(\sim p \vee q)\) Text Transcription: (p rightarrow q) rightarrow (sim p vee q)
Read more -
Chapter 3: Problem 40 Thinking Mathematically 6
In Exercises 33–56, use a truth table to determine whether each statement is a tautology, a self-contradiction, or neither. \((q \rightarrow p) \rightarrow(p \vee \sim q)\) Text Transcription: (q rightarrow p) rightarrow (p vee sim q)
Read more -
Chapter 3: Problem 41 Thinking Mathematically 6
Use a truth table to determine whether each statement is a tautology, a self-contradiction, or neither. \((p \wedge q) \wedge(\sim p \vee \sim q)\) Text Transcription: (p wedge q) wedge (sim p vee sim q)
Read more -
Chapter 3: Problem 42 Thinking Mathematically 6
In Exercises 33–56, use a truth table to determine whether each statement is a tautology, a self-contradiction, or neither. \((p \vee q) \wedge(\sim p \wedge \sim q)\) Text Transcription: (p vee q) wedge (sim p wedge sim q)
Read more -
Chapter 3: Problem 43 Thinking Mathematically 6
In Exercises 33–56, use a truth table to determine whether each statement is a tautology, a self-contradiction, or neither. \(\sim(p \wedge q) \leftrightarrow(\sim p \wedge \sim q)\)
Read more -
Chapter 3: Problem 44 Thinking Mathematically 6
In Exercises 33–56, use a truth table to determine whether each statement is a tautology, a self-contradiction, or neither. \(\sim(p \vee q) \leftrightarrow(\sim p \wedge \sim q)\) Text Transcription: sim (p vee q) leftrightarrow (sim p wedge sim q)
Read more -
Chapter 3: Problem 45 Thinking Mathematically 6
In Exercises 33–56, use a truth table to determine whether each statement is a tautology, a self-contradiction, or neither. \((p \rightarrow q) \leftrightarrow(q \rightarrow p)\) Text Transcription: (p rightarrow q) leftrightarrow (q rightarrow p)
Read more -
Chapter 3: Problem 46 Thinking Mathematically 6
In Exercises 33–56, use a truth table to determine whether each statement is a tautology, a self-contradiction, or neither. \((p \rightarrow q) \leftrightarrow(\sim p \rightarrow \sim q)\)
Read more -
Chapter 3: Problem 47 Thinking Mathematically 6
In Exercises 33–56, use a truth table to determine whether each statement is a tautology, a self-contradiction, or neither. \((p \rightarrow q) \leftrightarrow(\sim p \vee q)\) Text Transcription: (p rightarrow q) leftrightarrow (sim p vee q)
Read more -
Chapter 3: Problem 48 Thinking Mathematically 6
Use a truth table to determine whether each statement is a tautology, a self-contradiction, or neither. \((p \rightarrow q) \leftrightarrow (p~ \vee \sim q)\)
Read more -
Chapter 3: Problem 49 Thinking Mathematically 6
In Exercises 33–56, use a truth table to determine whether each statement is a tautology, a self-contradiction, or neither. \((p \leftrightarrow q) \leftrightarrow[(q \rightarrow p) \wedge(p \rightarrow q)]\) Text Transcription: (p leftrightarrow q) leftrightarrow [(q rightarrow p) wedge (p rightarrow q)]
Read more -
Chapter 3: Problem 50 Thinking Mathematically 6
In Exercises 33–56, use a truth table to determine whether each statement is a tautology, a self-contradiction, or neither. \((q \leftrightarrow p) \leftrightarrow[(p \rightarrow q) \wedge(q \rightarrow p)]\)
Read more -
Chapter 3: Problem 51 Thinking Mathematically 6
Use a truth table to determine whether each statement is a tautology, a self-contradiction, or neither. \((p \wedge q) \leftrightarrow(\sim p \vee r)\)
Read more -
Chapter 3: Problem 52 Thinking Mathematically 6
In Exercises 33–56, use a truth table to determine whether each statement is a tautology, a self-contradiction, or neither. \((p \wedge q) \rightarrow(\sim q \vee r)\) Text Transcription: (p wedge q) rightarrow (sim q vee r)
Read more -
Chapter 3: Problem 53 Thinking Mathematically 6
In Exercises 33–56, use a truth table to determine whether each statement is a tautology, a self-contradiction, or neither. \([(p \rightarrow q) \wedge(q \rightarrow r)] \rightarrow(p \rightarrow r)\) Text Transcription: [(p rightarrow q) wedge (q rightarrow r)] rightarrow (p rightarrow r)
Read more -
Chapter 3: Problem 54 Thinking Mathematically 6
In Exercises 33–56, use a truth table to determine whether each statement is a tautology, a self-contradiction, or neither. \([(p \rightarrow q) \wedge(q \rightarrow r)] \rightarrow(\sim r \rightarrow \sim p)\) Text Transcription: [(p rightarrow q) wedge (q rightarrow r)] rightarrow (sim r rightarrow sim p)
Read more -
Chapter 3: Problem 55 Thinking Mathematically 6
In Exercises 33–56, use a truth table to determine whether each statement is a tautology, a self-contradiction, or neither. \([(q \rightarrow r) \wedge(r \rightarrow \sim p)] \leftrightarrow(q \wedge p)\)
Read more -
Chapter 3: Problem 56 Thinking Mathematically 6
Use a truth table to determine whether each statement is a tautology, a self-contradiction, or neither. \([(q \rightarrow \sim r) \wedge(\sim r \rightarrow p)] \leftrightarrow(q \wedge \sim p)\) Text Transcription: [(q rightarrow sim r) wedge (sim r rightarrow p)] leftrightarrow (q wedge sim p)
Read more -
Chapter 3: Problem 57 Thinking Mathematically 6
In Exercises 57–64, a. Write each statement in symbolic form. Assign letters to simple statements that are not negated. b. Construct a truth table for the symbolic statement in part (a). c. Use the truth table to indicate one set of conditions that makes the compound statement false, or state that no such conditions exist. If you do homework right after class then you will not fall behind, and if you do not do homework right after class then you will.
Read more -
Chapter 3: Problem 58 Thinking Mathematically 6
In Exercises 57–64, a. Write each statement in symbolic form. Assign letters to simple statements that are not negated. b. Construct a truth table for the symbolic statement in part (a). c. Use the truth table to indicate one set of conditions that makes the compound statement false, or state that no such conditions exist. If you do a little bit each day then you’ll get by, and if you do not do a little bit each day then you won’t.
Read more -
Chapter 3: Problem 59 Thinking Mathematically 6
a. Write each statement in symbolic form. Assign letters to simple statements that are not negated. b. Construct a truth table for the symbolic statement in part (a). c. Use the truth table to indicate one set of conditions that makes the compound statement false, or state that no such conditions exist. If you “cut-and-paste” from the Internet and do not cite the source, then you will be charged with plagiarism.
Read more -
Chapter 3: Problem 60 Thinking Mathematically 6
a. Write each statement in symbolic form. Assign letters to simple statements that are not negated. b. Construct a truth table for the symbolic statement in part (a). c. Use the truth table to indicate one set of conditions that makes the compound statement false, or state that no such conditions exist. If you take more than one class with a lot of reading, then you will not have free time and you’ll be in the library until 1 a.m.
Read more -
Chapter 3: Problem 61 Thinking Mathematically 6
In Exercises 57–64, a. Write each statement in symbolic form. Assign letters to simple statements that are not negated. b. Construct a truth table for the symbolic statement in part (a). c. Use the truth table to indicate one set of conditions that makes the compound statement false, or state that no such conditions exist. You’ll be comfortable in your room if and only if you’re honest with your roommate, or you won’t enjoy the college experience.
Read more -
Chapter 3: Problem 62 Thinking Mathematically 6
In Exercises 57–64, a. Write each statement in symbolic form. Assign letters to simple statements that are not negated. b. Construct a truth table for the symbolic statement in part (a). c. Use the truth table to indicate one set of conditions that makes the compound statement false, or state that no such conditions exist. I fail the course if and only if I rely on a used book with highlightings by an idiot, or I do not buy a used book.
Read more -
Chapter 3: Problem 63 Thinking Mathematically 6
a. Write each statement in symbolic form. Assign letters to simple statements that are not negated. b. Construct a truth table for the symbolic statement in part (a). c. Use the truth table to indicate one set of conditions that makes the compound statement false, or state that no such conditions exist. I enjoy the course if and only if I choose the class based on the professor and not the course description.
Read more -
Chapter 3: Problem 64 Thinking Mathematically 6
a. Write each statement in symbolic form. Assign letters to simple statements that are not negated. b. Construct a truth table for the symbolic statement in part (a). c. Use the truth table to indicate one set of conditions that makes the compound statement false, or state that no such conditions exist. I do not miss class if and only if they take attendance or there are pop quizzes.
Read more -
Chapter 3: Problem 65 Thinking Mathematically 6
Determine the truth value for each statement when p is false, q is true, and r is false. \(\sim(p \rightarrow q)\) Text Transcription: sim (p rightarrow q)
Read more -
Chapter 3: Problem 66 Thinking Mathematically 6
Determine the truth value for each statement when p is false, q is true, and r is false. \(\sim(p \leftrightarrow q)\) Text Transcription: sim(p leftrightarrow q)
Read more -
Chapter 3: Problem 67 Thinking Mathematically 6
Determine the truth value for each statement when p is false, q is true, and r is false. \(\sim p \leftrightarrow q\) Text Transcription: sim p leftrightarrow q
Read more -
Chapter 3: Problem 68 Thinking Mathematically 6
Determine the truth value for each statement when p is false, q is true, and r is false. \(\sim p \rightarrow q\) Text Transcription: \(\sim p \rightarrow q\)
Read more -
Chapter 3: Problem 69 Thinking Mathematically 6
In Exercises 65–74, determine the truth value for each statement when p is false, q is true, and r is false. \(q \rightarrow(p \wedge r)\)
Read more -
Chapter 3: Problem 70 Thinking Mathematically 6
Determine the truth value for each statement when p is false, q is true, and r is false. \((p \wedge r) \rightarrow q\)
Read more -
Chapter 3: Problem 71 Thinking Mathematically 6
Determine the truth value for each statement when p is false, q is true, and r is false. \((\sim p \wedge q) \leftrightarrow \sim r\) Text Transcription: (sim p wedge q) leftrightarrow sim r
Read more -
Chapter 3: Problem 72 Thinking Mathematically 6
Determine the truth value for each statement when p is false, q is true, and r is false. \(\sim p \leftrightarrow(\sim q \wedge r)\)
Read more -
Chapter 3: Problem 73 Thinking Mathematically 6
Determine the truth value for each statement when p is false, q is true, and r is false. \(\sim[(p \rightarrow \sim r) \leftrightarrow(r \wedge \sim p)]\) Text Transcription: sim [(p rightarrow sim r) leftrightarrow (r wedge sim p)]
Read more -
Chapter 3: Problem 74 Thinking Mathematically 6
Determine the truth value for each statement when p is false, q is true, and r is false. \(\sim[(\sim p \rightarrow r) \leftrightarrow(p \vee \sim q)]\)
Read more -
Chapter 3: Problem 75 Thinking Mathematically 6
Use grouping symbols to clarify the meaning of each statement. Then construct a truth table for the statement. \(p \rightarrow q \leftrightarrow p \wedge q \rightarrow \sim p\) Text Transcription: p rightarrow q leftrightarrow p wedge q rightarrow sim p
Read more -
Chapter 3: Problem 76 Thinking Mathematically 6
Use grouping symbols to clarify the meaning of each statement. Then construct a truth table for the statement. \(q \rightarrow p \leftrightarrow p \vee q \rightarrow \sim p\) Text Transcription: q rightarrow p leftrightarrow p vee q rightarrow sim p
Read more -
Chapter 3: Problem 77 Thinking Mathematically 6
Use grouping symbols to clarify the meaning of each statement. Then construct a truth table for the statement. \(p \rightarrow \sim q \vee r \leftrightarrow p \wedge r\) Text Transcription: p rightarrow sim q vee r leftrightarrow p wedge r
Read more -
Chapter 3: Problem 78 Thinking Mathematically 6
In Exercises 75–78, use grouping symbols to clarify the meaning of each statement. Then construct a truth table for the statement. \(\sim p \rightarrow q \wedge r \leftrightarrow p \vee r\)
Read more -
Chapter 3: Problem 79 Thinking Mathematically 6
Construct a truth table for each statement. Then use the table to indicate one set of conditions that make the compound statement false or state that no such conditions exist. Loving a person is necessary for marrying that person, but not loving someone is sufficient for not marrying that person.
Read more -
Chapter 3: Problem 80 Thinking Mathematically 6
Construct a truth table for each statement. Then use the table to indicate one set of conditions that make the compound statement false or state that no such conditions exist. Studying hard is necessary for getting an A, but not studying hard is sufficient for not getting an A.
Read more -
Chapter 3: Problem 81 Thinking Mathematically 6
Construct a truth table for each statement. Then use the table to indicate one set of conditions that make the compound statement false or state that no such conditions exist. It is not true that being happy and living contentedly are necessary conditions for being wealthy.
Read more -
Chapter 3: Problem 82 Thinking Mathematically 6
Construct a truth table for each statement. Then use the table to indicate one set of conditions that make the compound statement false or state that no such conditions exist. It is not true that being wealthy is a sufficient condition for being happy and living contentedly.
Read more -
Chapter 3: Problem 83 Thinking Mathematically 6
The bar graph shows the percentage of American adults who believed in God, Heaven, the devil, and Hell in 2009 compared with 2003. Write each statement in symbolic form. (Increases or decreases in each simple statement refer to 2009 compared with 2003.) Then use the information in the graph to determine the truth value of each compound statement. If there was an increase in the percentage who believed in God and a decrease in the percentage who believed in Heaven, then there was an increase in the percentage who believed in the devil.
Read more -
Chapter 3: Problem 84 Thinking Mathematically 6
The bar graph shows the percentage of American adults who believed in God, Heaven, the devil, and Hell in 2009 compared with 2003. Write each statement in symbolic form. (Increases or decreases in each simple statement refer to 2009 compared with 2003.) Then use the information in the graph to determine the truth value of each compound statement. If there was a decrease in the percentage who believed in God, then it is not the case that there was an increase in the percentage who believed in the devil or in Hell.
Read more -
Chapter 3: Problem 85 Thinking Mathematically 6
The bar graph shows the percentage of American adults who believed in God, Heaven, the devil, and Hell in 2009 compared with 2003. Write each statement in symbolic form. (Increases or decreases in each simple statement refer to 2009 compared with 2003.) Then use the information in the graph to determine the truth value of each compound statement. There was a decrease in the percentage who believed in God if and only if there was an increase in the percentage who believed in Heaven, or the percentage believing in the devil decreased.
Read more -
Chapter 3: Problem 86 Thinking Mathematically 6
The bar graph shows the percentage of American adults who believed in God, Heaven, the devil, and Hell in 2009 compared with 2003. Write each statement in symbolic form. (Increases or decreases in each simple statement refer to 2009 compared with 2003.) Then use the information in the graph to determine the truth value of each compound statement. There was an increase in the percentage who believed in God if and only if there was an increase in the percentage who believed in Heaven, and the percentage believing in Hell decreased.
Read more -
Chapter 3: Problem 87 Thinking Mathematically 6
Sociologists Joseph Kahl and Dennis Gilbert developed a six-tier model to portray the class structure of the United States. The bar graph gives the percentage of Americans who are members of each of the six social classes. Write each statement in symbolic form. Then use the information given by the graph to determine the truth value of each compound statement. Fifteen percent are capitalists or it is not true that 34% are members of the upper-middle class, if and only if the number of working poor exceeds the number belonging to the working class.
Read more -
Chapter 3: Problem 88 Thinking Mathematically 6
Sociologists Joseph Kahl and Dennis Gilbert developed a six-tier model to portray the class structure of the United States. The bar graph gives the percentage of Americans who are members of each of the six social classes. Write each statement in symbolic form. Then use the information given by the graph to determine the truth value of each compound statement. Fifteen percent are capitalists and it is not true that 34% are members of the upper-middle class, if and only if the number of working poor exceeds the number belonging to the working class.
Read more -
Chapter 3: Problem 89 Thinking Mathematically 6
Sociologists Joseph Kahl and Dennis Gilbert developed a six-tier model to portray the class structure of the United States. The bar graph gives the percentage of Americans who are members of each of the six social classes. Write each statement in symbolic form. Then use the information given by the graph to determine the truth value of each compound statement. If there are more people in the lower-middle class than in the capitalist and upper-middle classes combined, then 1% are capitalists and 34% belong to the upper-middle class.
Read more -
Chapter 3: Problem 90 Thinking Mathematically 6
Sociologists Joseph Kahl and Dennis Gilbert developed a six-tier model to portray the class structure of the United States. The bar graph gives the percentage of Americans who are members of each of the six social classes. Write each statement in symbolic form. Then use the information given by the graph to determine the truth value of each compound statement. If there are more people in the lower-middle class than in the capitalist and upper-middle classes combined, then 1% are capitalists or 34% belong to the upper-middle class.
Read more -
Chapter 3: Problem 91 Thinking Mathematically 6
Explain when conditional statements are true and when they are false.
Read more -
Chapter 3: Problem 92 Thinking Mathematically 6
Explain when biconditional statements are true and when they are false.
Read more -
Chapter 3: Problem 93 Thinking Mathematically 6
What is the difference between a tautology and a self-contradiction?
Read more -
Chapter 3: Problem 94 Thinking Mathematically 6
Based on the meaning of the inclusive or, explain why it is reasonable that if \(p \vee q\) is true, then \(\sim p \rightarrow q\) must also be true. Text Transcription: p vee q sim p rightarrow q
Read more -
Chapter 3: Problem 95 Thinking Mathematically 6
Based on the meaning of the inclusive or, explain why if \(p \vee q\) is true, then \(p \rightarrow \sim q\) is not necessarily true. Text Transcription: p vee q p rightarrow sim q
Read more -
Chapter 3: Problem 96 Thinking Mathematically 6
Make Sense? Determine whether each statement makes sense or does not make sense, and explain your reasoning. The statement "If 2 + 2 = 5, then the moon is made of green cheese" is true in logic, but does not make much sense in everyday speech.
Read more -
Chapter 3: Problem 97 Thinking Mathematically 6
Make Sense? Determine whether each statement makes sense or does not make sense, and explain your reasoning. I'm working with a true conditional statement, but when I reverse the antecedent and the consequent, my new conditional statement is no longer true.
Read more -
Chapter 3: Problem 98 Thinking Mathematically 6
Make Sense? Determine whether each statement makes sense or does not make sense, and explain your reasoning. When asked the question "What is time?", the fourth-century Christian philosopher St. Augustine replied, "If you don't ask me, I know, but if you ask me, I don't know." I constructed a truth table for St. Augustine's statement and discovered it is a tautology.
Read more -
Chapter 3: Problem 99 Thinking Mathematically 6
In Exercises 96–99, determine whether each statement makes sense or does not make sense, and explain your reasoning. In “Computing Machines and Intelligence,” the English mathematician Alan Turing (1912–1954) wrote, “If each man had a definite set of rules of conduct by which he regulated his life, he would be a machine, but there are no such rules, so men cannot be machines.” I constructed a truth table for Turing’s statement and discovered it is a tautology
Read more -
Chapter 3: Problem 100 Thinking Mathematically 6
Consider the statement “If you get an A in the course, I’ll take you out to eat.” If you complete the course and I do take you out to eat, can you conclude that you got an A? Explain your answer.
Read more -
Chapter 3: Problem 101 Thinking Mathematically 6
The headings for the columns in the truth tables are missing. Fill in the statements to replace the missing headings. (More than one correct statement may be possible.)
Read more -
Chapter 3: Problem 102 Thinking Mathematically 6
The headings for the columns in the truth tables are missing. Fill in the statements to replace the missing headings. (More than one correct statement may be possible.)
Read more