Solution Found!
Determine the Fourier series coefficients for each of the following discrete-time
Chapter 3, Problem 3.28(choose chapter or problem)
Determine the Fourier series coefficients for each of the following discrete-time periodic signals. Plot the magnitude and phase of each set of coefficients ak (a) Each x[n] depicted in Figure P3.28(a)-(c) (b) x[n] = sin(27Tn/3)cos(7Tn/2) (c) x[n] periodic with period 4 and x[n] = 1 - sin :n for 0 :5 n :5 3 (d) x[n] periodic with period 12 and x n [ ] = - 1 sm 1rn f 0 11 4 or :5 n :5
Questions & Answers
QUESTION:
Determine the Fourier series coefficients for each of the following discrete-time periodic signals. Plot the magnitude and phase of each set of coefficients ak (a) Each x[n] depicted in Figure P3.28(a)-(c) (b) x[n] = sin(27Tn/3)cos(7Tn/2) (c) x[n] periodic with period 4 and x[n] = 1 - sin :n for 0 :5 n :5 3 (d) x[n] periodic with period 12 and x n [ ] = - 1 sm 1rn f 0 11 4 or :5 n :5
ANSWER:Step 1 of 4
a) Refer to the Figure 3.28-a) in book. As we can see, the period of the discrete-time signal 


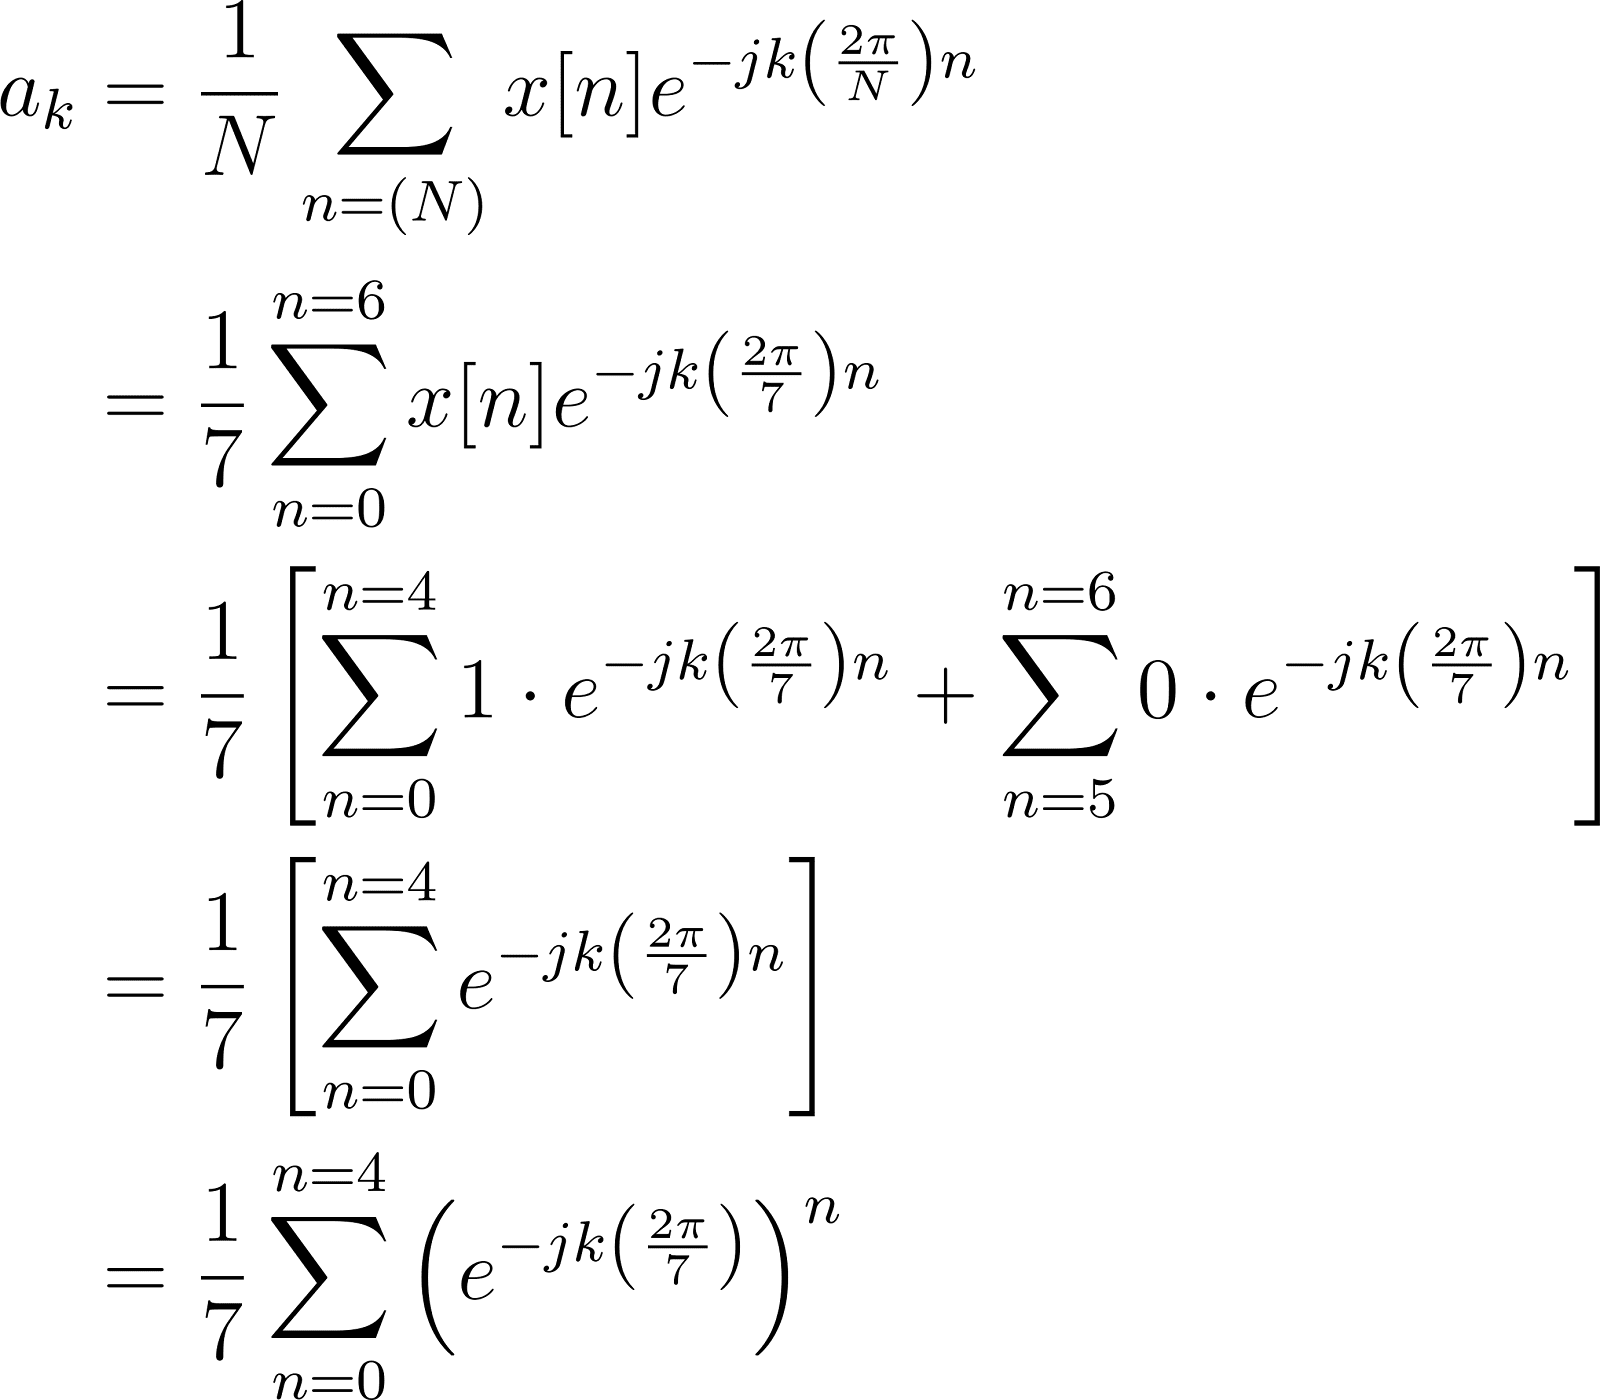
Now we can use relation:

Then we have:

Notice that for 

To determine 


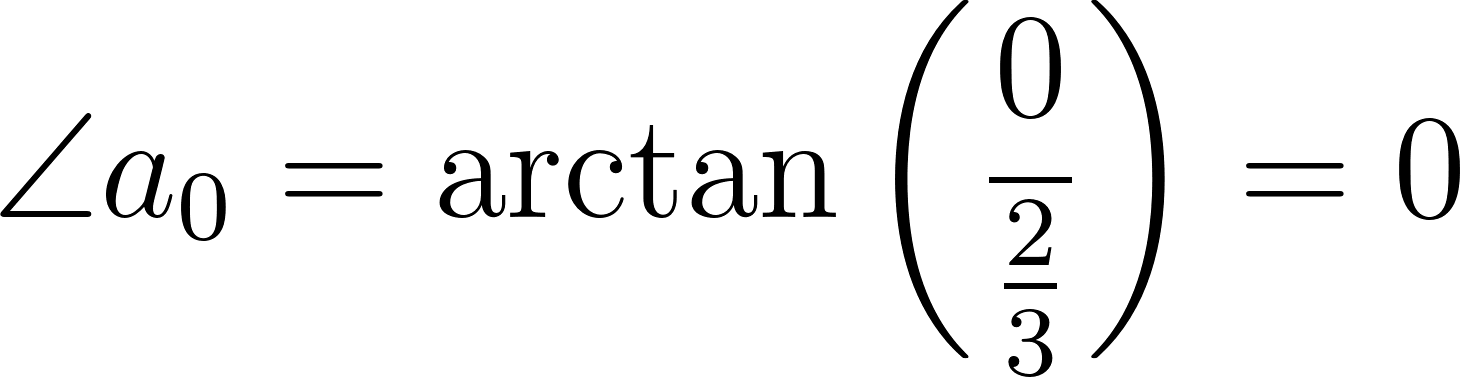
Now we can determine the phase of 

To plot the magnitude and phase of 

Refer to the Figure 


Now we can use relation:

Then we have:

Notice that for 


To determine 

Now we can determine the phase of

To plot the magnitude and phase of 

Refer to the Figure $3.28-\mathrm{c}$ ) in book. As we can see, the period of the discrete-time signal $\boldsymbol{x}[\boldsymbol{n}]$ is: $\mathrm{N}=6$. Then we can determine the Fourier coefficients $a_k$ :

Notice that:


Then we have:

To plot the magnitude and phase of 
