Problem 67E New York bridges We saw in this chapter that in Tompkins County, New York, older bridges were in worse condition than newer ones. Tompkins is a rural area. Is this relationship true in New York City as well? Here are data on the Condition (as measured by the state Department of Transportation Condition Index) and Age at Inspection for bridges in New York City. a) New York State defines any bridge with a condition score less than 5 as deficient. What does this model predict for the condition scores of New York City bridges? b) Our earlier model found that the condition of bridges in Tompkins County was decreasing at about 0.025 per year. What does this model say about New York City bridges? c) How much faith would you place in this model? Explain.
Read moreTable of Contents
Textbook Solutions for Stats: Data and Models
Question
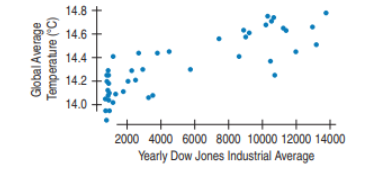
Climate change 2013, revisited In Exercise 69, we saw the relationship between CO2 measured at Mauna Loa and average global temperatures from 1970 to 2013. Here is a plot of average global temperatures plotted against the yearly average of the Dow Jones Industrial Average for the same time period
A regression produces the following output table (in part):
\(\begin{array}{l}
\text { Dependent variable is Global Temperature }\left({ }^{\circ} \mathrm{C}\right)\\
\begin{array}{ll}
\text { R-squared }=68.6 \% & \\
\text { Variable } & \text { Coefficient } \\
\text { Intercept } & 14.09 \\
\text { DJIA } & 0.0000459
\end{array}
\end{array}\)
a) What is the correlation between the DJIA and Temperature?
b) Explain the meaning of R-squared in this context.
c) Give the regression equation.
d) What is the meaning of the slope in this equation?
e) What is the meaning of the y-intercept of this equation?
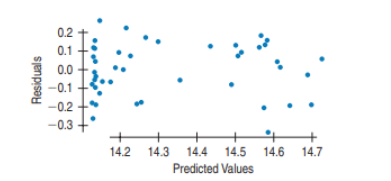
f) Here is a scatterplot of the residuals vs. predicted values. Does this plot show evidence of the violation of any assumptions behind the regression? If so, which ones?
g) Suppose the Dow hits 20,000 in 2020. What mean Temperature does the regression predict for that level?
h) Does the answer in g) mean that when the Dow hits 20,000, the Temperature will reach the predicted level? Explain briefly.
Solution
Step 1 of 9
Given that,
A regression produces the following output table (in part):
|
Dependent variable is Global Temperature \(\left({ }^{\circ} \mathrm{c}\right)\) |
|
|
R-squared = 68.6% |
|
|
Variable |
Coefficient |
|
Intercept |
14.09 |
|
DJIA |
0.0000459 |
full solution
Climate change 2013, revisited In Exercise 69, we saw the
Chapter 6 textbook questions
-
Chapter 7: Problem 67 Stats: Data and Models 4
-
Chapter 7: Problem 69 Stats: Data and Models 4
Problem 69E Climate change 2013 The earth’s climate is getting warmer. The most common theory attributes the increase to an increase in atmospheric levels of carbon dioxide (CO2), a greenhouse gas. Here is a scatterplot showing the mean annual CO2 concentration in the atmosphere, measured in parts per million (ppm) at the top of Mauna Loa in Hawaii, and the mean annual air temperature over both land and sea across the globe, in degrees Celsius (°C) for the years 1970 to 2013. a) What is the correlation between CO2 and Temperature? b) Explain the meaning of R-squared in this context. c) Give the regression equation. d) What is the meaning of the slope in this equation? e) What is the meaning of the y-intercept of this equation? f) Here is a scatterplot of the residuals vs. predicted values. Does this plot show evidence of the violation of any assumptions behind the regression? If so, which ones? g) CO2 levels will probably reach 400 ppm by 2020. What mean Temperature does the regression predict for that concentration of CO2? h) Does the answer in g) mean that when the CO2 level hits 400 ppm, the Temperature will reach the predicted level? Explain briefly.
Read more -
Chapter 7: Problem 68 Stats: Data and Models 4
Problem 68E Birthrates 2010 The table shows the number of live births per 1000 population in the United States, starting in 1965. (National Center for Health Statistics, www.cdc.gov/nchs/) a) Make a scatterplot and describe the general trend in Birthrates. (Enter Year as years since 1900: 65, 70, 75, etc.) b) Find the equation of the regression line. c) Check to see if the line is an appropriate model. Explain. d) Interpret the slope of the line. e) The table gives rates only at 5-year intervals. Estimate what the rate was in 1978. f) In 1978, the birthrate was actually 15.0. How close did your model come? g) Predict what the Birthrate will be in 2010. Comment on your faith in this prediction. h) Predict the Birthrate for 2050. Comment on your faith in this prediction.
Read more -
Chapter 7: Problem 71 Stats: Data and Models 4
Problem 71E Body fat It is difficult to determine a person’s body fat percentage accurately without immersing him or her in water. Researchers hoping to find ways to make a good estimate immersed 20 male subjects, then measured their waists and recorded their weights. Waist(in.) Weight(lb) Body Fat(%) Waist(in.) Weight(lb) Body Fat(%) 32 175 6 33 188 10 36 181 21 40 240 20 38 200 15 36 175 22 33 159 6 32 168 9 39 196 22 44 246 38 40 192 31 33 160 10 41 205 32 41 215 27 35 173 21 34 159 12 38 187 25 34 146 10 38 188 30 44 219 28 a) Create a model to predict %Body Fat from Weight. ________________ b) Do you think a linear model is appropriate? Explain. ________________ c) Interpret the slope of your model. ________________ d) Is your model likely to make reliable estimates? Explain. ________________ e) What is the residual for a person who weighs 190 pounds and has 21% body fat?
Read more -
Chapter 7: Problem 72 Stats: Data and Models 4
Problem 72E Body fat again Would a model that uses the person’s Waist size be able to predict the %Body Fatmore accurately than one that uses Weight? Using the data in Exercise, create and analyze that model. Exercise Body fat It is difficult to determine a person’s body fat percentage accurately without immersing him or her in water. Researchers hoping to find ways to make a good estimate immersed 20 male subjects, then measured their waists and recorded their weights. Waist(in.) Weight(lb) Body Fat(%) Waist(in.) Weight(lb) Body Fat(%) 32 175 6 33 188 10 36 181 21 40 240 20 38 200 15 36 175 22 33 159 6 32 168 9 39 196 22 44 246 38 40 192 31 33 160 10 41 205 32 41 215 27 35 173 21 34 159 12 38 187 25 34 146 10 38 188 30 44 219 28 a) Create a model to predict %Body Fat from Weight. ________________ b) Do you think a linear model is appropriate? Explain. ________________ c) Interpret the slope of your model. ________________ d) Is your model likely to make reliable estimates? Explain. ________________ e) What is the residual for a person who weighs 190 pounds and has 21% body fat?
Read more -
Chapter 7: Problem 73 Stats: Data and Models 4
Problem 73E Heptathlon revisited We discussed the women’s 2012 Olympic heptathlon in Chapter 6. Here are the results from the high jump, 800-meter run, and long jump for the 26 women who successfully completed all three events in the 2004 Olympics (www.espn.com): Let’s examine the association among these events. Perform a regression to predict high-jump performance from the 800-meter results. a) What is the regression equation? What does the slope mean? b) What percent of the variability in high jumps can be accounted for by differences in 800-m times? c) Do good high jumpers tend to be fast runners? (Be careful—low times are good for running events and high distances are good for jumps.) d) What does the residuals plot reveal about the model? e) Do you think this is a useful model? Would you use it to predict high-jump performance? (Compare the residual standard deviation to the standard deviation of the high jumps.)
Read more -
Chapter 7: Problem 70 Stats: Data and Models 4
Problem 70E Climate change 2013, revisited In Exercise 69, we saw the relationship between CO2 measured at Mauna Loa and average global temperatures from 1970 to 2013. Here is a plot of average global temperatures plotted against the yearly average of the Dow Jones Industrial Average for the same time period a) What is the correlation between the DJIA and Temperature? b) Explain the meaning of R-squared in this context. c) Give the regression equation. d) What is the meaning of the slope in this equation? e) What is the meaning of the y-intercept of this equation? f) Here is a scatterplot of the residuals vs. predicted values. Does this plot show evidence of the violation of any assumptions behind the regression? If so, which ones? g) Suppose the Dow hits 20,000 in 2020. What mean Temperature does the regression predict for that level? h) Does the answer in g) mean that when the Dow hits 20,000, the Temperature will reach the predicted level? Explain briefly. Exercise 69: Climate change 2013 The earth’s climate is getting warmer. The most common theory attributes the increase to an increase in atmospheric levels of carbon dioxide (CO2), a greenhouse gas. Here is a scatterplot showing the mean annual CO2 concentration in the atmosphere, measured in parts per million (ppm) at the top of Mauna Loa in Hawaii, and the mean annual air temperature over both land and sea across the globe, in degrees Celsius (°C) for the years 1970 to 2013. a) What is the correlation between CO2 and Temperature? b) Explain the meaning of R-squared in this context. c) Give the regression equation. d) What is the meaning of the slope in this equation? e) What is the meaning of the y-intercept of this equation? f) Here is a scatterplot of the residuals vs. predicted values. Does this plot show evidence of the violation of any assumptions behind the regression? If so, which ones? g) CO2 levels will probably reach 400 ppm by 2020. What mean Temperature does the regression predict for that concentration of CO2? h) Does the answer in g) mean that when the CO2 level hits 400 ppm, the Temperature will reach the predicted level? Explain briefly.
Read more -
Chapter 7: Problem 76 Stats: Data and Models 4
Problem 76E Gators Wildlife researchers monitor many wildlife populations by taking aerial photographs. Can they estimate the weights of alligators accurately from the air? Here is a regression analysis of the Weight of alligators (in pounds) and their Length (in inches) based on data collected about captured alligators. a) Did they choose the correct variable to use as the dependent variable and the predictor? Explain. b) What is the correlation between an alligator’s length and weight? c) Write the regression equation. d) Interpret the slope of the equation in this context. e) Do you think this equation will allow the scientists to make accurate predictions about alligators? What part of the regression analysis indicates this? What additional concerns do you have?
Read more -
Chapter 7: Problem 78 Stats: Data and Models 4
Problem 78E Least squares II Consider the four points (200,1950), (400,1650), (600,1800), and (800,1600). The least squares line is yn = 1975 - 0.45x. Explain what “least squares” means, using these data as a specific example.
Read more -
Chapter 7: Problem 77 Stats: Data and Models 4
Problem 77E Least squares I Consider the four points (10, 10), (20, 50), (40, 20), and (50,80). The least squares line is yn = 7.0 + 1.1x. Explain what “least squares” means, using these data as a specific example.
Read more -
Chapter 7: Problem 75 Stats: Data and Models 4
Problem 75E Hard water revisited In an investigation of environmental causes of disease, data were collected on the annual mortality rate (deaths per 100,000) for males in 61 large towns in England and Wales. In addition, the water hardness was recorded as the calcium concentration (parts per million, ppm) in the drinking water. The following display shows the relationship between Mortality and Calcium concentration for these towns: a) Describe what you see in this scatterplot, in context. b) Here is the regression analysis of Mortality and Calcium concentration. What is the regression equation? c) Interpret the slope and y-intercept of the line, in context. d) The largest residual, with a value of -348.6, is for the town of Exeter. Explain what this value means. e) The hardness of Derby’s municipal water is about 100 ppm of calcium. Use this equation to predict the mortality rate in Derby. f) Explain the meaning of R-squared in this situation
Read more -
Chapter 7: Problem 74 Stats: Data and Models 4
Problem 74E Heptathlon revisited again We saw the data for the women’s 2004 Olympic heptathlon in Exercise 73. Are the two jumping events associated? Perform a regression of the long-jump results on the high-jump results. a) What is the regression equation? What does the slope mean? b) What percentage of the variability in long jumps can be accounted for by high-jump performances? c) Do good high jumpers tend to be good long jumpers? d) What does the residuals plot reveal about the model? e) Do you think this is a useful model? Would you use it to predict long-jump performance? (Compare the residual standard deviation to the standard deviation of the long jumps.) Exercise 73: Heptathlon revisited We discussed the women’s 2012 Olympic heptathlon in Chapter 6. Here are the results from the high jump, 800-meter run, and long jump for the 26 women who successfully completed all three events in the 2004 Olympics (www.espn.com): Let’s examine the association among these events. Perform a regression to predict high-jump performance from the 800-meter results. a) What is the regression equation? What does the slope mean? b) What percent of the variability in high jumps can be accounted for by differences in 800-m times? c) Do good high jumpers tend to be fast runners? (Be careful—low times are good for running events and high distances are good for jumps.) d) What does the residuals plot reveal about the model? e) Do you think this is a useful model? Would you use it to predict high-jump performance? (Compare the residual standard deviation to the standard deviation of the high jumps.)
Read more -
Chapter 7: Problem 1 Stats: Data and Models 4
Problem 1E True or false If false, explain briefly. a) We choose the linear model that passes through the most data points on the scatterplot. ________________ b) The residuals are the observed y-values minus the y-values predicted by the linear model. ________________ c) Least squares means that the square of the largest residual is as small as it could possibly be.
Read more -
Chapter 7: Problem 2 Stats: Data and Models 4
Problem 2E True or false II If false, explain briefly. a) Some of the residuals from a least squares linear model will be positive and some will be negative. ________________ b) Least Squares means that some of the squares of the residuals are minimized. ________________ c) We write ? to denote the predicted values and y to denote the observed values.
Read more -
Chapter 7: Problem 3 Stats: Data and Models 4
Problem 3E Least squares interpretations A least squares regression line was calculated to relate the length (cm) of newborn boys to their weight in kg. The line is Explain in words what this model means. Should new parents (who tend to worry) be concerned if their newborn’s length and weight don’t fit this equation?
Read more -
Chapter 7: Problem 5 Stats: Data and Models 4
Bookstore sales revisited Recall the data we saw in Chapter 6, exercise 3 for a bookstore. The manager wants to predict Sales from Number of Sales People Working. a) Find the slope estimate, \(b_1\). b) What does it mean, in this context? c) Find the intercept, \(b_0\). d) What does it mean, in this context? Is it meaningful? e) Write down the equation that predicts Sales from Number of Sales People Working. f) If 18 people are working, what Sales do you predict? g) If sales are actually $25,000, what is the value of the residual? h) Have we overestimated or underestimated the sales?
Read more -
Chapter 7: Problem 4 Stats: Data and Models 4
Residual interpretations The newborn grandson of one of the authors was 48 cm long and weighed 3 kg. According to the regression model of Exercise 3, what was his residual? What does that say about him?
Read more -
Chapter 7: Problem 6 Stats: Data and Models 4
Problem 6E Disk drives 2014 again Recall the data on disk drives we saw in chapter 6 exercise 4. Suppose we want to predict Price from Capacity. a) Find the slope estimate, b1. b) What does it mean, in this context? c) Find the intercept, b0. d) What does it mean, in this context? Is it meaningful? e) Write down the equation that predicts Price from Capacity. f) What would you predict for the price of a 20 TB drive? g) A 20 TB drive on Amazon.com was listed at $2017.86. According to the model, does this seem like a good buy? How much would you save compared to what you expected to pay? h) Does the model overestimate or underestimate the price? i) The correlation is very high. Does this mean that the model is accurate? Explain. (Hint: Revisit the scatterplot from chapter 6 exercise 4.)
Read more -
Chapter 7: Problem 7 Stats: Data and Models 4
Problem 7E Sophomore slump? A CEO complains that the winners of his “rookie junior executive of the year” award often turn out to have less impressive performance the following year. He wonders whether the award actually encourages them to slack off. Can you offer a better explanation?
Read more -
Chapter 7: Problem 8 Stats: Data and Models 4
Problem 8E Sophomore slump again? An online investment blogger advises investing in mutual funds that have performed badly the past year because “regression to the mean tells us that they will do well next year.” Is he correct?
Read more -
Chapter 7: Problem 9 Stats: Data and Models 4
Problem 9E Bookstore sales once more Here are the residuals for a regression of Sales on Number of Sales People Working for the bookstore of exercise 5: a) What are the units of the residuals? b) Which residual contributes the most to the sum that was minimized according to the Least Squares Criterion to find this regression? c) Which residual contributes least to that sum?
Read more -
Chapter 7: Problem 10 Stats: Data and Models 4
Problem 10E Disk drives 2014, residuals Here are the residuals for a regression of Price on Capacity for the hard drives of Exercise 6. (based on the hand-computed coefficients.) a) Which residual contributes the most to the sum that is minimized by the Least Squares criterion? b) Five of the residuals are negative. What does that mean about those drives? Be specific and use the correct units.
Read more -
Chapter 7: Problem 13 Stats: Data and Models 4
Residual plots Here are residual plots (residuals plotted against predicted values) for three linear regression models. Indicate which condition appears to be violated (linearity, outlier or equal spread) in each case.
Read more -
Chapter 7: Problem 12 Stats: Data and Models 4
Disk drives encore For the hard drive data of Exercise 6, find and interpret the value of \(R^{2}\).
Read more -
Chapter 7: Problem 15 Stats: Data and Models 4
Problem 15E Cereals For many people, breakfast cereal is an important source of fiber in their diets. Cereals also contain potassium, a mineral shown to be associated with maintaining a healthy blood pressure. An analysis of the amount of fiber (in grams) and the potassium content (in milligrams) in servings of 77 breakfast cereals produced the regression model Fiber. If your cereal provides 9 grams of fiber per serving, how much potassium does the model estimate you will get?
Read more -
Chapter 7: Problem 18 Stats: Data and Models 4
Problem 18E Engine size again Exercise 16 describes a regression model that uses a car’s engine size to estimate its fuel economy. In this context, what does it mean to say that a certain car has a positive residual? Exercise 16: Engine size In Chapter 6, Exercise 41 we examined the relationship between the fuel economy (mpg) and Engine Size for 35 models of cars (Data in Fuel Economy 2014). Further analysis produces the regression model Engine size. If the car you are thinking of buying has a 4 liter engine, what does this model suggest your gas mileage would be?
Read more -
Chapter 7: Problem 11 Stats: Data and Models 4
Problem 11E Bookstore sales last time For the regression model for the bookstore of Exercise, what is the value of R2 and what does it mean? Exercise Bookstore sales revisited Recall the data we saw in Chapter, Exercise 1 for a bookstore. The manager wants to predict Sales from Number of Sales People Working. Number of Sales People Working Sales(in$1000) 2 10 3 11 7 13 9 14 10 18 10 20 12 20 15 22 16 22 20 26 Here is the regression analysis of Sales vs.Number of Sales People Working. Dependent variable is Sales R-squared = 93.2% s=1.477 Variable Coefficient Intercept 8.1006 Num_Workers 0.9134 a) Write the regression equation. Define the variables used in your equation. ________________ b) What does the slope mean in this context? ________________ c) What does the y-intercept mean in this context? Is it meaningful? ________________ d) If 18 people are working, what Sales do you predict? ________________ e) If sales for the 18 people are actually $25,000, what is the value of the residual? ________________ f) Have we overestimated or underestimated the sales? Exercise1 Scatterplots Which of the four scatterplots show a) little or no association? ________________ b) a negative association? ________________ c) a linear association? ________________ d) a moderately strong association? ________________ e) a very strong association? 1. 2. 3. 4.
Read more -
Chapter 7: Problem 16 Stats: Data and Models 4
Engine size In Chapter 6, Exercise 41 we examined the relationship between the fuel economy (mpg) and Engine Size for 35 models of cars (Data in Fuel Economy 2014). Further analysis produces the regression model \(\widehat {mpg} = 36.25 - 3.867\) Engine size. If the car you are thinking of buying has a 4 liter engine, what does this model suggest your gas mileage would be?
Read more -
Chapter 7: Problem 14 Stats: Data and Models 4
Problem 14E Disk drives last time Here is a scatterplot of the residuals from the regression of the hard drive prices on their sizes from Exercise. a) Are any assumptions or conditions violated? If so, which ones? ________________ b) What would you recommend about this regression? Exercise Disk drives again In Chapter, Exercise1, we saw some data on hard drives. After correcting for an outlier, these data look like this: we want to predict Price from Capacity. Capacity (in TB) Price (in $) 0.080 29.95 0.120 35.00 0.250 49.95 0.320 69.95 1.0 99.00 2.0 205.00 4.0 449.00 Here is the regression analysis of Price vs. Capacity. Dependent variable is Price R-squared = 98.8%, s = 17.95 Variable Coefficient Intercept 18.617 Capacity 103.929 a) Write the regression equation. Define the variables used in your equation. ________________ b) What does the slope mean in this context? ________________ c) What does the y-intercept mean in this context? Is it meaningful? ________________ d) What would you predict for the price of a 3.0 TB drive? ________________ e) You found a 3.0 TB drive for $300. Is this a good buy? How much would you save compared to what you Expected to buy? ________________ f) Does the model overestimate or underestimate the price for a 3.0 TB drive? Exercise 1 Scatterplots Which of the scatterplots below show a) little or no association? ________________ b) a negative association? ________________ c) a linear association? ________________ d) a moderately strong association? ________________ e) a very strong association? 1. 2. 3. 4.
Read more -
Chapter 7: Problem 19 Stats: Data and Models 4
Another bowl In Exercise 15, the regression model \(\widehat{\text { Potassium }}=38+27\) Fiber relates fiber (in grams) and potassium content (in milligrams) in servings of breakfast cereals. Explain what the slope means.
Read more -
Chapter 7: Problem 17 Stats: Data and Models 4
Problem 17E More cereal Exercise describes a regression model that estimates a cereal’s potassium content from the amount of fiber it contains. In this context, what does it mean to say that a cereal has a negative residual? Exercise Cereals For many people, breakfast cereal is an important source of fiber in their diets. Cereals also contain potassium, a mineral shown to be associated with maintaining a healthy blood pressure. An analysis of the amount of fiber (in grams) and the potassium content (in milligrams) in servings of 77 breakfast cereals produced the regression model Fiber. If your cereal provides 9 grams of fiber per serving, how much potassium does the model estimate you will get?
Read more -
Chapter 7: Problem 20 Stats: Data and Models 4
More engine size In Exercise 16, the regression model \(\widehat{m p g}=36.25-3.867\) Engine Size relates cars’ engine size to their fuel economy (in mpg). Explain what the slope means.
Read more -
Chapter 7: Problem 22 Stats: Data and Models 4
Another car The correlation between a car’s engine size and its fuel economy (in mpg) is r = -0.8476. What fraction of the variability in fuel economy is accounted for by the engine size?
Read more -
Chapter 7: Problem 21 Stats: Data and Models 4
Cereal again The correlation between a cereal’s fiber and potassium contents is r = 0.903. What fraction of the variability in potassium is accounted for by the amount of fiber that servings contain?
Read more -
Chapter 7: Problem 23 Stats: Data and Models 4
Last bowl! For Exercise 15’s regression model predicting potassium content (in milligrams) from the amount of fiber (in grams) in breakfast cereals, \(s_e = 30.77\). Explain in this context what that means.
Read more -
Chapter 7: Problem 26 Stats: Data and Models 4
More regression equations Fill in the missing information in the following table.
Read more -
Chapter 7: Problem 25 Stats: Data and Models 4
Problem 25E Regression equations Fill in the missing information in the following table.
Read more -
Chapter 7: Problem 24 Stats: Data and Models 4
Last tank! For Exercise 16’s regression model predicting fuel economy (in mpg) from the car’s engine size, \(s_{e} = 3.265\). Explain in this context what that means.
Read more -
Chapter 7: Problem 28 Stats: Data and Models 4
Problem 28E Residuals II Tell what each of the residual plots below indicates about the appropriateness of the linear model that was fit to the data. a. b. c.
Read more -
Chapter 7: Problem 27 Stats: Data and Models 4
Problem 27E Residuals I Tell what each of the residual plots below Indicates about the appropriateness of the linear model that was fit to the data. a. b. c.
Read more -
Chapter 7: Problem 32 Stats: Data and Models 4
Problem 32E What slope II? If you create a regression model for estimating the Height of a pine tree (in feet) based on the Circumference of its trunk (in inches), is the slope most likely to be 0.1, 1, 10, or 100? Explain.
Read more -
Chapter 7: Problem 30 Stats: Data and Models 4
Coasters 2014, revisited The data set on roller coasters from Chapter 6, Exercise 23 lists the Duration of the ride in seconds in addition to the Drop height in feet. One coaster (the “Tower of Terror”) is unusual for having large drop but a short ride. After setting it aside, a regression to predict Duration from Drop for the remaining 85 coasters has \(R^{2} = 32.0 \%\). a) What are the variables and units in this regression? b) What units does the slope have? c) Do you think the slope is positive or negative? Explain.
Read more -
Chapter 7: Problem 29 Stats: Data and Models 4
Real estate A random sample of records of home sales from Feb. 15 to Apr. 30, 1993, from the files maintained by the Albuquerque Board of Realtors gives the Price and Size (in square feet) of 117 homes. A regression to predict Price (in thousands of dollars) from Size has an \(R^2\) of 71.4%. The residuals plot indicated that a linear model is appropriate. a) What are the variables and units in this regression? b) What units does the slope have? c) Do you think the slope is positive or negative? Explain.
Read more -
Chapter 7: Problem 33 Stats: Data and Models 4
Problem 33E Real estate again The regression of Price on Size of homes in Albuquerque had R2 = 71.4% as described in Exercise. Write a sentence (in context, of course) summarizing what the R2 says about this regression. Exercise Real estate A random sample of records of sales of homes from February 15 to April 30, 1993, from the files maintained by the Albuquerque Board of Realtors gives the Price and Size (in square feet) of 117 homes. A regression to predict Price (in thousands of dollars) from Size has an R-squared of 71.4%. The residuals plot indicated that a linear model is appropriate. a) What are the variables and units in this regression? ________________ b) What units does the slope have? ________________ c) Do you think the slope is positive or negative? Explain.
Read more -
Chapter 7: Problem 31 Stats: Data and Models 4
Problem 31E What slope I? If you create a regression model for predicting the Weight of a car (in pounds) from its Length (in feet), is the slope most likely to be 3, 30, 300, or 3000? Explain.
Read more -
Chapter 7: Problem 34 Stats: Data and Models 4
Problem 34E Coasters 2014 again Exercise 30 examined the association between the Duration of a roller coaster ride and the height of its initial Drop, reporting that R2 = 32.0%. Write a sentence (in context, of course) summarizing what the R2 says about this regression.
Read more -
Chapter 7: Problem 35 Stats: Data and Models 4
Problem 35E Misinterpretations A Biology student who created a regression model to use a bird’s Height when perched for predicting its Wingspan made these two statements. Assuming the calculations were done correctly, explain what is wrong with each interpretation. a) My R2 of 93% shows that this linear model is appropriate. ________________ b) A bird 10 inches tall will have a wingspan of 17 inches.
Read more -
Chapter 7: Problem 36 Stats: Data and Models 4
Problem 36E More misinterpretations A Sociology student investigated the association between a country’s Literacy Rate and Life Expectancy, then drew the conclusions listed below. Explain why each statement is incorrect. (Assume that all the calculations were done properly.) a) The Literacy Rate determines 64% of the Life Expectancy for a country. ________________ b) The slope of the line shows that an increase of 5% in Literacy Rate will produce a 2-year improvement in Life Expectancy.
Read more -
Chapter 7: Problem 37 Stats: Data and Models 4
Real estate redux The regression of Price on Size of homes in Albuquerque had \(R^{2} = 71.4 \%\), as described in Exercise 29. a) What is the correlation between Size and Price? b) What would you predict about the Price of a home 1 SD above average in Size? c) What would you predict about the Price of a home 2 SDs below average in Size?
Read more -
Chapter 7: Problem 38 Stats: Data and Models 4
Problem 38E Another ride The regression of Duration of a roller coaster ride on the height of its initial Drop, described in Exercise 30, had R2 = 32.0%. a) What is the correlation between Drop and Duration? b) What would you predict about the Duration of the ride on a coaster whose initial Drop was 1 standard deviation below the mean Drop? c) What would you predict about the Duration of the ride on a coaster whose initial Drop was 3 standard deviations above the mean Drop?
Read more -
Chapter 7: Problem 39 Stats: Data and Models 4
Problem 39E ESP People who claim to “have ESP” participate in a screening test in which they have to guess which of several images someone is thinking of. You and a friend both took the test. You scored 2 standard deviations above the mean, and your friend scored 1 standard deviation below the mean. The researchers offer everyone the opportunity to take a retest. a) Should you choose to take this retest? Explain. ________________ b) Now explain to your friend what his decision should be and why.
Read more -
Chapter 7: Problem 40 Stats: Data and Models 4
Problem 40E SI jinx Players in any sport who are having great seasons, turning in performances that are much better than anyone might have anticipated, often are pictured on the cover of Sports Illustrated. Frequently, their performances then falter somewhat, leading some athletes to believe in a “Sports Illustrated jinx.” Similarly, it is common for phenomenal rookies to have less stellar second seasons—the so-called “sophomore slump.” While fans, athletes, and analysts have proposed many theories about what leads to such declines, a statistician might offer a simpler (statistical) explanation. Explain.
Read more -
Chapter 7: Problem 41 Stats: Data and Models 4
Problem 41E More real estate Consider the Albuquerque home sales from Exercise again. The regression analysis gives the model a) Explain what the slope of the line says about housing prices and house size. ________________ b) What price would you predict for a 3000-square-foot house in this market? ________________ c) A real estate agent shows a potential buyer a 1200-square-foot home, saying that the asking price is $6000 less than what one would expect to pay for a house of this size. What is the asking price, and what is the $6000 called? Exercise Real estate A random sample of records of sales of homes from February 15 to April 30, 1993, from the files maintained by the Albuquerque Board of Realtors gives the Price and Size (in square feet) of 117 homes. A regression to predict Price (in thousands of dollars) from Size has an R-squared of 71.4%. The residuals plot indicated that a linear model is appropriate. a) What are the variables and units in this regression? ________________ b) What units does the slope have? ________________ c) Do you think the slope is positive or negative? Explain.
Read more -
Chapter 7: Problem 46 Stats: Data and Models 4
Attendance 2013, revisited Consider again the regression of Average Attendance on Wins for the baseball teams examined in Exercise 44. a) What is the correlation between Wins and Average Attendance? b) What would you predict about the Average Attendance for a team that is 2 standard deviations above average in Wins? c) If a team is 1 standard deviation below average in attendance, what would you predict about the number of games the team has won?
Read more -
Chapter 7: Problem 42 Stats: Data and Models 4
Problem 42E Last ride Consider the roller coasters (with the outlier removed) described in Exercise 30 again. The regression analysis gives the model Drop. a) Explain what the slope of the line says about how long a roller coaster ride may last and the height of the coaster. b) A new roller coaster advertises an initial drop of 200 feet. How long would you predict the rides last? c) Another coaster with a 150-foot initial drop advertises a 2 and a half-minute ride. Is this longer or shorter than you’d expect? By how much? What’s that called?
Read more -
Chapter 7: Problem 44 Stats: Data and Models 4
Problem 44E Attendance 2013, revisited In the previous chapter, you looked at the relationship between the number of wins by American League baseball teams and the average attendance at their home games for the 2013 season. Here are the scatterplot, the residuals plot, and part of the regression analysis: a) Do you think a linear model is appropriate here? Explain. b) Interpret the meaning of R2 in this context. c) Do the residuals show any pattern worth remarking on? d) The point at the top of the plots is the New York Yankees. What can you say about the residual for the Yankees?
Read more -
Chapter 7: Problem 43 Stats: Data and Models 4
Problem 43E Cigarettes Is the nicotine content of a cigarette related to the “tars”? A collection of data (in milligrams) on 29 cigarettes produced the scatterplot, residuals plot, and regression analysis shown: Dependent variable is: nicotine R squared = 92.4% Variable Coefficient Constant 0.154030 Tar 0.065052 a) Do you think a linear model is appropriate here? Explain. ________________ b) Explain the meaning of R2 in this context.
Read more -
Chapter 7: Problem 45 Stats: Data and Models 4
Another cigarette Consider again the regression of Nicotine content on Tar (both in milligrams) for the cigarettes examined in Exercise 43. a) What is the correlation between Tar and Nicotine? b) What would you predict about the average Nicotine content of cigarettes that are 2 standard deviations below average in Tar content? c) If a cigarette is 1 standard deviation above average in Nicotine content, what do you suspect is true about its Tar content?
Read more -
Chapter 7: Problem 48 Stats: Data and Models 4
Problem 48E Attendance 2013, last inning Refer again to the regression analysis for average attendance and games won by American League baseball teams, seen in Exercise 44. a) Write the equation of the regression line. b) Estimate the Average Attendance for a team with 50 Wins. c) Interpret the meaning of the slope of the regression line in this context. d) In general, what would a negative residual mean in this context? e) The St. Louis Cardinals, the 2013 NL Champions, are not included in these data because they are a National League team. During the 2013 regular season, the Cardinals won 97 games and averaged 41,602 fans at their home games. Calculate the residual for this team, and explain what it means. Exercise 44: Attendance 2013, revisited In the previous chapter, you looked at the relationship between the number of wins by American League baseball teams and the average attendance at their home games for the 2013 season. Here are the scatterplot, the residuals plot, and part of the regression analysis: a) Do you think a linear model is appropriate here? Explain. b) Interpret the meaning of R2 in this context. c) Do the residuals show any pattern worth remarking on? d) The point at the top of the plots is the New York Yankees. What can you say about the residual for the Yankees?
Read more -
Chapter 7: Problem 50 Stats: Data and Models 4
Problem 50E Interest rates and mortgages 2013 again In Chapter 6, Exercise 40, we saw a plot of mortgages in the United States (in trillions of 2013 dollars) vs. the interest rate at various times over the past 25 years. The correlation is r = -0.80. The mean mortgage amount is $3.926 T and the mean interest rate is 7.194%. The standard deviations are $1.515 T for mortgage amounts and 2.055% for the interest rates. a) Is a regression model appropriate for predicting mortgage amount from interest rates? Explain. b) Regardless of your answer to a), find the equation that predicts mortgage amount from interest rates? c) What would you predict the mortgage amount would be if the interest rates climbed to 13%? d) Do you have any reservations about your prediction in part c? Explain. e) If we standardized both variables, what would be the regression equation that predicts standardized mortgage amount from standardized interest rates? f) If we standardized both variables, what would be the regression equation that predicts standardized interest rates from standardized mortgage amount?
Read more -
Chapter 7: Problem 49 Stats: Data and Models 4
Problem 49E Income and housing revisited In Chapter, Exercise, we learned that the Office of Federal Housing Enterprise Oversight (OFHEO) collects data on various aspects of housing costs around the United States. Here’s a scatterplot (by state) of the Housing Cost Index (HCI) versus the Median Family Income (MFI) for the 50 states. The correlation is r = 0.65. The mean HCI is 338.2, with a standard deviation of 116.55. The mean MFI is $46,234, with a standard deviation of $7072.47. a) Is a regression analysis appropriate? Explain. ________________ b) What is the equation that predicts Housing Cost Index from median family income? ________________ c) For a state with MFI = +44,993, what would be the predicted HCI? ________________ d) Washington, DC, has an MFI of $44,993 and an HCI of 548.02. How far off is the prediction in c) from the actual HCI? ________________ e) If we standardized both variables, what would be the regression equation that predicts standardized HCI from standardized MFI? ________________ f) If we standardized both variables, what would be the regression equation that predicts standardized MFI from standardized HCI?
Read more -
Chapter 7: Problem 47 Stats: Data and Models 4
Problem 47E Last cigarette Take another look at the regression analysis of tar and nicotine content of the cigarettes in Exercise 43. a) Write the equation of the regression line. b) Estimate the Nicotine content of cigarettes with 4 milligrams of Tar. c) Interpret the meaning of the slope of the regression line in this context. d) What does the y-intercept mean? e) If a new brand of cigarette contains 7 milligrams of tar and a nicotine level whose residual is -0.5 mg, what is the nicotine content? Exercise 43: Cigarettes Is the nicotine content of a cigarette related to the “tar”? A collection of data (in milligrams) on 29 cigarettes produced the scatterplot, residuals plot, and regression analysis shown: a) Do you think a linear model is appropriate here? Explain. b) Explain the meaning of R2 in this context.
Read more -
Chapter 7: Problem 52 Stats: Data and Models 4
Online clothes II For the online clothing retailer discussed in the previous problem, the scatterplot of Total Yearly Purchases by Income looks like this: The correlation between Total Yearly Purchases and Income is 0.722. Summary statistics for the two variables are: a) What is the linear regression equation for predicting Total Yearly Purchase from Income? b) Do the assumptions and conditions for regression appear to be met? c) What is the predicted Total Yearly Purchase for someone with a yearly Income of $20,000? For someone with an annual Income of $80,000? d) What percent of the variability in Total Yearly Purchases is accounted for by this model? e) Do you think the regression might be a useful one for the company? Comment.
Read more -
Chapter 7: Problem 51 Stats: Data and Models 4
Problem 51E Online clothes An online clothing retailer keeps track of its customers’ purchases. For those customers who signed up for the company’s credit card, the company also has information on the customer’s Age and Income. A random sample of 500 of these customers shows the following scatterplot of Total Yearly Purchases by Age: The correlation between Total Yearly Purchases and Age is r = 0.037. Summary statistics for the two variables are: Mean SD Age 29.67 yrs 8.51 yrs Total Yearly Purchase $572.52 $253.62 a) What is the linear regression equation for predicting Total Yearly Purchase from Age? ________________ b) Do the assumptions and conditions for regression appear to be met? ________________ c) What is the predicted average Total Yearly Purchase for an 18-year-old? For a 50-year-old? ________________ d) What percent of the variability in Total Yearly Purchases is accounted for by this model? ________________ e) Do you think the regression might be a useful one for the company? Explain.
Read more -
Chapter 7: Problem 54 Stats: Data and Models 4
Problem 54E Success in college Colleges use SAT scores in the admissions process because they believe these scores provide some insight into how a high school student will perform at the college level. Suppose the entering freshmen at a certain college have mean combined SAT Scores of 1222, with a standard deviation of 123. In the first semester, these students attained a mean GPA of 2.66, with a standard deviation of 0.56. A scatterplot showed the association to be reasonably linear, and the correlation between SAT score and GPA was 0.47. a) Write the equation of the regression line. b) Explain what the y-intercept of the regression line indicates. c) Interpret the slope of the regression line. d) Predict the GPA of a freshman who scored a combined 1400 e) Based upon these statistics, how effective do you think SAT scores would be in predicting academic success during the first semester of the freshman year at this college? Explain. f) As a student, would you rather have a positive or a negative residual in this context? Explain.
Read more -
Chapter 7: Problem 53 Stats: Data and Models 4
SAT scores The SAT is a test often used as part of an application to college. SAT scores are between 200 and 800, but have no units. Tests are given in both Math and Verbal areas. SAT-Math problems require the ability to read and understand the questions, but can a person’s verbal score be used to predict the math score? Verbal and math SAT scores of a high school graduating class are displayed in the scatterplot, with the regression line added. a) Describe the relationship. b) Are there any students whose scores do not seem to fit the overall pattern? c) For these data, r = 0.685. Interpret this statistic. d) These verbal scores averaged 596.3, with a standard deviation of 99.5, and the math scores averaged 612.2, with a standard deviation of 96.1. Write the equation of the regression line. e) Interpret the slope of this line. f) Predict the math score of a student with a verbal score of 500. g) Every year, some students score a perfect 1600. Based on this model, what would such a student’s residual be for her math score?
Read more -
Chapter 7: Problem 56 Stats: Data and Models 4
Problem 56E Success, part 2 Based on the statistics for college freshmen given in Exercise 54, what SAT score would you predict for a freshmen who attained a first-semester GPA of 3.0? Exercise 54: Success in college Colleges use SAT scores in the admissions process because they believe these scores provide some insight into how a high school student will perform at the college level. Suppose the entering freshmen at a certain college have mean combined SAT Scores of 1222, with a standard deviation of 123. In the first semester, these students attained a mean GPA of 2.66, with a standard deviation of 0.56. A scatterplot showed the association to be reasonably linear, and the correlation between SAT score and GPA was 0.47. a) Write the equation of the regression line. b) Explain what the y-intercept of the regression line indicates. c) Interpret the slope of the regression line. d) Predict the GPA of a freshman who scored a combined 1400 e) Based upon these statistics, how effective do you think SAT scores would be in predicting academic success during the first semester of the freshman year at this college? Explain. f) As a student, would you rather have a positive or a negative residual in this context? Explain.
Read more -
Chapter 7: Problem 55 Stats: Data and Models 4
Problem 55E SAT, take 2 Suppose we wanted to use SAT math scores to estimate verbal scores based on the information in Exercise 53. a) What is the correlation? b) Write the equation of the line of regression predicting verbal scores from math scores. c) In general, what would a positive residual mean in this context? d) A person tells you her math score was 500. Predict her verbal score. e) Using that predicted verbal score and the equation you created in Exercise 53, predict her math score. f) Why doesn’t the result in part e come out to 500? Exercise 53: SAT scores The SAT is a test often used as part of an application to college. SAT scores are between 200 and 800, but have no units. Tests are given in both Math and Verbal areas. SAT-Math problems require the ability to read and understand the questions, but can a person’s verbal score be used to predict the math score? Verbal and math SAT scores of a high school graduating class are displayed in the scatterplot, with the regression line added. a) Describe the relationship. b) Are there any students whose scores do not seem to fit the overall pattern? c) For these data, r = 0.685. Interpret this statistic. d) These verbal scores averaged 596.3, with a standard deviation of 99.5, and the math scores averaged 612.2, with a standard deviation of 96.1. Write the equation of the regression line. e) Interpret the slope of this line. f) Predict the math score of a student with a verbal score of 500. g) Every year, some students score a perfect 1600. Based on this model, what would such a student’s residual be for her math score?
Read more -
Chapter 7: Problem 57 Stats: Data and Models 4
Problem 57E Wildfires 2012 The National Interagency Fire Center (www.nifc.gov) reports statistics about wildfires. Here’s an analysis of the number of wildfires between 1985 and 2012. a) Is a linear model appropriate for these data? Explain. b) Interpret the slope in this context. c) Can we interpret the intercept? Why or why not? d) What does the value of se say about the size of the residuals? What does it say about the effectiveness of the model? e) What does R2 mean in this context?
Read more -
Chapter 7: Problem 58 Stats: Data and Models 4
Problem 58E Wildfires 2012—sizes We saw in Exercise 57 that the number of fires was nearly constant. But has the damage they cause remained constant as well? Here’s a regression that examines the trend in Acres per Fire, (in hundreds of thousands of acres) together with some supporting plots: a) Is the regression model appropriate for these data? Explain. b) Interpret the slope in this context. c) Can we interpret the intercept? Why or why not? d) What interpretation (if any) can you give for the R2 in the regression table?
Read more -
Chapter 7: Problem 59 Stats: Data and Models 4
Problem 59E Used cars 2014 Carmax.com lists numerous Toyota Corollas for sale within a 250 mile radius of Redlands, CA. Listed at the top of the next column are the ages of the cars and the advertised prices. a) Make a scatterplot for these data. b) Describe the association between Age and Price of a used Corolla. c) Do you think a linear model is appropriate? d) Computer software says that R2 = 75.2%. What is the correlation between Age and Price? e) Explain the meaning of R2 in this context. f) Why doesn’t this model explain 100% of the variability in the price of a used Corolla?
Read more -
Chapter 7: Problem 62 Stats: Data and Models 4
Problem 62E Veggie burgers Burger King introduced a meat-free burger in 2002. The nutrition label is shown here: a) Use the regression model created in this chapter, Protein, to predict the fat content of this burger from its protein content. b) What is its residual? How would you explain the residual? c) Write a brief report about the Fat and Protein content of this menu item. Be sure to talk about the variables by name and in the correct units.
Read more -
Chapter 7: Problem 61 Stats: Data and Models 4
Problem 61E More used cars 2014 Use the advertised prices for Toyota Corollas given in Exercise 59 to create a linear model for the relationship between a car’s Age and its Price. a) Find the equation of the regression line. b) Explain the meaning of the slope of the line. c) Explain the meaning of the y-intercept of the line. d) If you want to sell a 7-year-old Corolla, what price seems appropriate? e) You have a chance to buy one of two cars. They are about the same age and appear to be in equally good condition. Would you rather buy the one with a positive residual or the one with a negative residual? Explain. f) You see a “For Sale” sign on a 10-year-old Corolla stating the asking price as $8,500. What is the residual? g) Would this regression model be useful in establishing a fair price for a 25-year-old car? Explain.
Read more -
Chapter 7: Problem 60 Stats: Data and Models 4
Problem 60E Drug abuse In the exercises of the last chapter you examined results of a survey conducted in the United States and 10 countries of Western Europe to determine the percentage of teenagers who had used marijuana and other drugs. Below is the scatterplot. Summary statistics showed that the mean percent that had used marijuana was 23.9%, with a standard deviation of 15.6%. An average of 11.6% of teens had used other drugs, with a standard deviation of 10.2%. a) Do you think a linear model is appropriate? Explain. ________________ b) For this regression, R2 is 87.3%. Interpret this statistic in this context. ________________ c) Write the equation you would use to estimate the percentage of teens who use other drugs from the percentage who have used marijuana. ________________ d) Explain in context what the slope of this line means. ________________ e) Do these results confirm that marijuana is a “gateway drug,” that is, that marijuana use leads to the use of other drugs?
Read more -
Chapter 7: Problem 63 Stats: Data and Models 4
Problem 63E Burgers revisited In the last chapter, you examined the association between the amounts of Fat and Calories in fast-food hamburgers. Here are the data: a) Create a scatterplot of Calories vs. Fat. b) Interpret the value of R2 in this context. c) Write the equation of the line of regression. d) Use the residuals plot to explain whether your linear model is appropriate. e) Explain the meaning of the y-intercept of the line. f) Explain the meaning of the slope of the line. g) A new burger containing 28 grams of fat is introduced. According to this model, its residual for calories is +33. How many calories does the burger have?
Read more -
Chapter 7: Problem 65 Stats: Data and Models 4
Problem 65E A second helping of burgers In Exercise 63, you created a model that can estimate the number of Calories in a burger when the Fat content is known. a) Explain why you cannot use that model to estimate the fat content of a burger with 600 calories. b) Using an appropriate model, estimate the fat content of a burger with 600 calories. Exercise 63: Burgers revisited In the last chapter, you examined the association between the amounts of Fat and Calories in fast-food hamburgers. Here are the data: a) Create a scatterplot of Calories vs. Fat. b) Interpret the value of R2 in this context. c) Write the equation of the line of regression. d) Use the residuals plot to explain whether your linear model is appropriate. e) Explain the meaning of the y-intercept of the line. f) Explain the meaning of the slope of the line. g) A new burger containing 28 grams of fat is introduced. According to this model, its residual for calories is +33. How many calories does the burger have?
Read more -
Chapter 7: Problem 64 Stats: Data and Models 4
Problem 64E Chicken Chicken sandwiches are often advertised as a healthier alternative to beef because many are lower in fat. Tests on 11 brands of fast-food chicken sandwiches produced the following summary statistics and scatterplot from a graphing calculator: a) Do you think a linear model is appropriate in this situation? b) Describe the strength of this association. c) Write the equation of the regression line. d) Explain the meaning of the slope. e) Explain the meaning of the y–intercept. f) What does it mean if a certain sandwich has a negative residual? g) If a chicken sandwich and a burger each advertised 35 grams of fat, which would you expect to have more calories (see Exercise 63)? h) McDonald’s Filet-O-Fish sandwich has 26 grams of fat and 470 calories. Does the fat–calorie relationship in this sandwich appear to be very different from that found in chicken sandwiches or in burgers (see Exercise 63)? Explain.
Read more -
Chapter 7: Problem 66 Stats: Data and Models 4
Cost of living 2013 Numbeo.com lists the cost of living (COL) for many cities around the world. These rankings scale New York City as 100, and express the cost of living in other cities as a percentage of the New York cost. For example, the table below shows 25 of the most expensive cities in the world, and indicates that the cost of living in Paris was 30.3% higher than New York in 2010, but only 25.0% higher in 2013. a) Using the scatterplot below, describe the association between costs of living in 2010 and 2013. b) The correlation is 0.714. Find and interpret the value of \(R^{2}\). c) The regression equation predicting the 2013 cost of living from the 2010 figure is \(\widehat {COL 2013} = -38.292 + 1.319\) COL 2010. Use this equation to find the residual for Oslo. d) Explain what the residual means.
Read more