Solution Found!
Life expectancy The data in the table below list the Life
Chapter 9, Problem 17RE(choose chapter or problem)
Problem 17RE
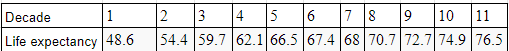
Life expectancy The data in the table below list the Life Expectancy for white males in the United States every decade during the last century (1 = 1900 to 1910, 2 = 1911 to 1920, etc.). Create a model to predict future increases in life expectancy. (National Vital Statistics Report)
Decade |
1 |
2 |
3 |
4 |
5 |
6 |
7 |
8 |
9 |
10 |
11 |
Life exp. |
48.6 |
54.4 |
59.7 |
62.1 |
66.5 |
67.4 |
68.0 |
70.7 |
72.7 |
74.9 |
76.5 |
Questions & Answers
QUESTION:
Problem 17RE
Life expectancy The data in the table below list the Life Expectancy for white males in the United States every decade during the last century (1 = 1900 to 1910, 2 = 1911 to 1920, etc.). Create a model to predict future increases in life expectancy. (National Vital Statistics Report)
Decade |
1 |
2 |
3 |
4 |
5 |
6 |
7 |
8 |
9 |
10 |
11 |
Life exp. |
48.6 |
54.4 |
59.7 |
62.1 |
66.5 |
67.4 |
68.0 |
70.7 |
72.7 |
74.9 |
76.5 |
ANSWER:
Step 1 of 2
The given data is