Solution Found!
Solved: (a) Sketch a graph of velocity versus time
Chapter 2, Problem 27(choose chapter or problem)
(a) Sketch a graph of velocity versus time corresponding to the graph of displacement versus time given in Figure 2.55.
(b) Identify the time or times (\(t_{a}\), \(t_{b}\), \(t_{c}\), etc.) at which the instantaneous velocity is greatest.
(c) At which times is it zero?
(d) At which times is it negative?

Questions & Answers
QUESTION:
(a) Sketch a graph of velocity versus time corresponding to the graph of displacement versus time given in Figure 2.55.
(b) Identify the time or times (\(t_{a}\), \(t_{b}\), \(t_{c}\), etc.) at which the instantaneous velocity is greatest.
(c) At which times is it zero?
(d) At which times is it negative?
ANSWER:
Step 1 of 4
(a)
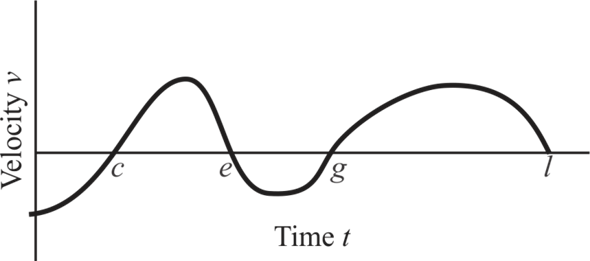
The slope of the graph of position versus time gives the velocity. The tangents drawn on the given point give the direction of the velocity,
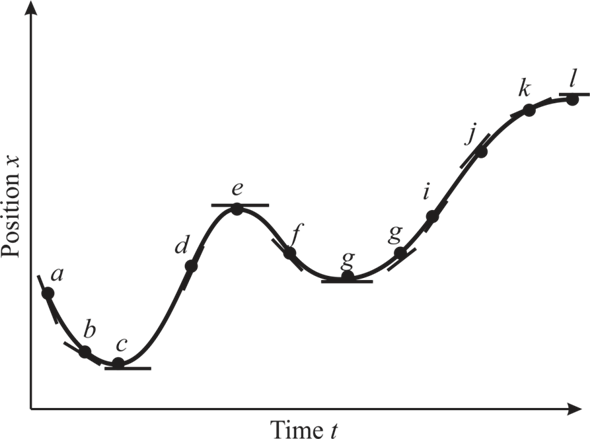
The slope is negative at a and b and zero at c. Therefore, the velocity starts at negative and becomes zero at c. The slope at d is positive, and it becomes zero at e; again, the slope is negative at f and zero at g, the slope is positive at i, j negative at k and zero at l.
From the graph and the conclusion, the graph for velocity and time is as follows: