Problem 171SE Steel rod quality. In his essay “Making Things Right,” W. Edwards Deming considered the role of statistics in the quality control of industrial products.* In one example, Deming examined the quality-control process for a manufacturer of steel rods. Rods produced with diameters smaller than 1 centimeter fit too loosely in their bearings and ultimately must be rejected (thrown out). To determine whether the diameter setting of the machine that produces the rods is correct, 500 rods are selected from the day’s production and their diameters are recorded. The distribution of the 500 diameters for one day’s production is shown in the accompanying figure. Note that the symbol LSL in the figure represents the 1-centimeter lower specification limit of the steel rod diameters. There has been speculation that some of the inspectors are unaware of the trouble that an undersized rod diameter would cause later in the manufacturing process. Consequently, these inspectors may be passing rods with diameters that are barely below the lower specification limit and recording them in the interval centered at 1.000 centimeter. According to the figure, is there any evidence to support this claim? Explain.
Read moreTable of Contents
Textbook Solutions for Statistics for Business and Economics
Question
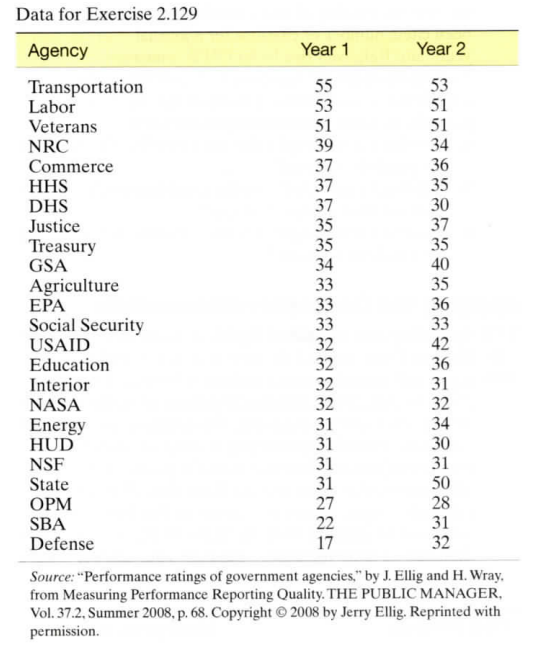
Performance ratings of government agencies. The U.S. Office of Management and Budget (OMB) requires government agencies to produce annual performance and accounting reports (PARS) each year. A research team at George Mason University evaluated the quality of the PARS for 24 government agencies (The Public Manager, Summer 2008). Evaluation scores ranged from 12 (lowest) to 60 (highest). The PARS evaluation scores for two consecutive years are shown in the next table.
a. Construct a scattergram for the data. Do you detect a trend in the data?
b. Based on the graph, identify one or two agencies that had greater than expected PARS evaluation scores for 2008.
Solution
Step 1 of 3
Let us consider a data set:
Agency |
Year1 |
Year 2 |
Transportation |
55 |
53 |
Labor |
53 |
51 |
Veterans |
51 |
51 |
NRC |
39 |
34 |
Commerce |
37 |
36 |
HHS |
37 |
35 |
DHS |
37 |
30 |
Justice |
35 |
37 |
Treasury |
35 |
35 |
GSA |
34 |
40 |
Agriculture |
33 |
35 |
EPA |
33 |
36 |
Social Security |
33 |
33 |
USAID |
32 |
42 |
Education |
32 |
36 |
Interior |
32 |
31 |
NASA |
32 |
32 |
Energy |
31 |
34 |
HUD |
31 |
30 |
NSF |
31 |
31 |
State |
31 |
50 |
OPM |
27 |
28 |
SBA |
22 |
31 |
Defense |
17 |
32 |
Here our goal is:
a). We need to construct a scatterplot for the data. Also we have to check the trend in the data.
b). We need to identify one or two agencies that had greater than expected PARS evaluation scores for year 2.
full solution
Performance ratings of government agencies. The U.S.
Chapter 2 textbook questions
-
Chapter 2: Problem 171 Statistics for Business and Economics 12
-
Chapter 2: Problem 3 Statistics for Business and Economics 12
Problem 3E Do social robots walk or roll? According to the United Nations, social robots now outnumber industrial robots worldwide. A social (or service) robot is designed to entertain, educate, and care for human users. In a paper published by the International Conference on Social Robotics (Vol. 6414, 2010), design engineers investigated the trend in the design of social robots. Using a random sample of 106 social robots obtained through a Web search, the engineers found that 63 were built with legs only, 20 with wheels only, 8 with both legs and wheels, and 15 with neither legs nor wheels. This information is portrayed in the accompanying graph. a. What type of graph is used to describe the data? b. Indentify the variable measured for each of the 106 robot designs. c. Use the graph to identify the social robot design that is currently used the most. d. Compute class relative frequencies for the different categories shown in the graph. e. Use the results from, part d to construct a Pareto diagram for the data.
Read more -
Chapter 2: Problem 1 Statistics for Business and Economics 12
Complete the following table.
Read more -
Chapter 2: Problem 2 Statistics for Business and Economics 12
Problem 2E A qualitative variable with three classes (X, Y, and Z) is measured for each of 20 units randomly sampled from a target population. The data (observed class for each unit) are listed below. a. Compute the frequency for each of the three classes. b. Compute the relative frequency for each of the three classes. c. Display the results, part a, in a frequency bar graph. d. Display the results, part b, in a pie chart.
Read more -
Chapter 2: Problem 5 Statistics for Business and Economics 12
Problem 5E Profiling UK rental malls. An analysis of the retail rental levels of tenants of United Kingdom regional shopping malls was published in Urban Studies (June 2011). One aspect of the study involved describing the type of tenant typically found at a UK shopping mall. Data were collected for 148 Shopping malls, which housed 1,821 stores. Tenants were categorized into five different-size groups based on amount of floor space: anchor tenants (more than 30,000 square feet), major space users (between 10,000 and 30,000 sq. ft.), large standard tenants (between 4,000 and 10,000 sq. ft.), small standard tenants (between 1,500 and 4,000 sq. ft.), and small tenants (less than 1,500 sq. ft.). The number of stores in each tenant category was reported as 14, 61, 216, 711, and 819, respectively. Use this information to construct a Pareto diagram for the distribution of tenant groups at UK shopping malls. Interpret the graph.
Read more -
Chapter 2: Problem 4 Statistics for Business and Economics 12
Problem 4E Paying for music downloads. If you use the Internet, have you ever paid to access or download music? This was one of the questions of interest in a recent Pew Internet & American Life Project Survey (October 2010). Telephone interviews were conducted on a representative sample of 1,003 adults living in the United States. For this sample, 248 adults stated that they do not use the Internet, 249 revealed that they use the Internet but have never paid to download music, and the remainder (506 adults) admitted that they use the Internet and have paid to download music. The results are summarized in the Minitab pie chart shown. a. According to the pie chart, what proportion of the sample use the Internet and pay to download music? Verify the accuracy of this proportion using the survey results. b. Now consider only the 755 adults in the sample that use the Internet. Create a graph that compares the proportions of these adults that pay to download music with the proportion that do not pay to download music.
Read more -
Chapter 2: Problem 6 Statistics for Business and Economics 12
Problem 6E Who is to blame for rising health care costs? Rising health care costs are of major concern to Americans. A nationwide survey of 2,119 U.S. adults was conducted to elicit opinions on who is to blame for the rising costs (The Harris Poll, Oct. 28, 2008). The next table summarizes the responses to the question “When you think of the rising costs of health care, who do you think is most responsible?” a. Compute the relative frequencies in each response category. b. Construct a relative frequency bar graph for the data. c. Convert the relative frequency bar graph into a Pareto diagram. Interpret the graph.
Read more -
Chapter 2: Problem 7 Statistics for Business and Economics 12
PIN pad shipments. Personal identification number (PIN) pads are devices that connect to point-of-sale electronic cash registers for debit and credit card purchases. The PIN pad allows the customer’s card to be accessed and the PIN encrypted before it is sent to the transaction manager.The Nilson Report (Oct. 2008) listed the volume of PIN pad shipments by manufacturers worldwide in 2007. For the 12 manufacturers listed in the table, a total of 334,039 PIN pads were shipped in 2007. a. One of the 334,039 PIN pads is selected and the manufacturer of the pad is determined. What type of data (quantitative or qualitative) is measured? b. Construct a frequency bar chart for the data summarized in the table. c. Convert the frequency bar chart, part b, into a Pareto diagram. Interpret the results.
Read more -
Chapter 2: Problem 10 Statistics for Business and Economics 12
Problem 10E The Executive Compensation Scoreboard. Refer to the Forbes “Executive Compensation Scoreboard” for 2011, described in Chapter 1 and in Exercise 1.21 (p. 26). Recall that the industry type of the CEO’s company (e.g., banking, retailing, etc.) was recorded for each of the 175 CEOs with the highest efficiency (pay-for-performance) ratings. (See Table 1.1, p. 4, for a list of the industries.) Access the data file and use a graphical method to describe the frequency of occurrence of the industry types. 1.21 The executive compensation scoreboard. Each year, Forbes publishes its Executive Compensation Scoreboard. (See Study 1.2, p. 4) For the 2011 scoreboard, data were collected for chief executive officers at the 500 largest U.S. companies and the following variables were measured for each CEO: (1) the industry type of the CEO’s company (e.g., banking, retailing, etc.), (2) the CEO’s total compensation ($ millions) for the year, (3) the CEO’s total compensation ($ millions) over the previous 5 years, (4) the number of company stock shares (millions) held, (5) the CEO’s age (years), and (6) the CEO’s efficiency rating. a. Are the data for the 500 CEOs in the 2011 Executive Compensation Scoreboard a population or sample? Explain. b. Identify the type (quantitative or qualitative) of each variable measured.
Read more -
Chapter 2: Problem 11 Statistics for Business and Economics 12
Problem 11E Doctors and ethics. For physicians confronted with ethical dilemmas (e.g., end-of-life issues or treatment of patients without insurance), many hospitals provide ethics consultation services. However, not all physicians take advantage of these services and some refuse to use ethics consultation. The extent to which doctors refuse ethics consults was studied in the Journal of Medical Ethics (Vol. 32, 2006). Survey questionnaires were administered to all physicians on staff at a large community hospital in Tampa, Florida, and 118 physicians responded. Several qualitative variables were measured, including previous use of ethics consultation (“never used” or “used at least once”), practitioner specialty (“medical” or “surgical”), and future use of ethics consultation (“yes” or “no”). a. Access the file and generate a graph that describes the level to which the physicians on staff have previously used the ethics consultation services. What proportion of the sampled physicians have never used ethics consultation? b. Repeat part a for future use of ethics consultation. What proportion of the sampled physicians state that they will not use the services in the future? c. Generate side-by-side graphs that illustrate differences in previous use of ethics consultation by medical and surgical specialists. What inference can you make from the graphs? d. Repeat part c for future use of ethics consultation.
Read more -
Chapter 2: Problem 8 Statistics for Business and Economics 12
Problem 8E The economic return to earning an MBA. Refer to the International Economic Review (August 2008) study on the economic rewards to obtaining an MBA degree, Exercise 1.25 (p. 26). Job status information was collected for a sample of 3,244 individuals who sat for the GMAT in each of four time periods (waves). Summary information (number of individuals) for Wave 1 (at the time of taking the GMAT) and Wave 4 (7 years later) is provided in the accompanying table. Use a graph to compare and contrast the job status distributions of GMAT takers in Wave 1 and Wave 4. 1.25 The economic return to earning an MBA. What are the economic rewards (e.g., higher salary) to obtaining an MBA degree? This was the question of interest in an article published in the International Economic Review (August 2008). The researchers made inferences based on wage data collected for a sample of 3,244 individuals who sat for the Graduate Management Admissions Test (GMAT). (The GMAT exam is required for entrance into most MBA programs.) The following sampling scheme was employed. All those who took the GMAT exam in any of four selected time periods (Jan. 1990, Sep. 1991, Jan. 1993, and Jan. 1997) were mailed a questionnaire. Those who responded to the questionnaire were then sent three follow-up surveys (one survey every 3 months). The final sample of 3,244 represents only those individuals who responded to all four surveys. (For example, about 5,600 took the GMAT in Jan. 1990; of these, only about 800 responded to all four surveys.) a. For this study, describe the population of interest. b. What method was used to collect the sample data? c. Do you think the final sample is representative of the population? Who or why not? Comment on potential biases in the sample.
Read more -
Chapter 2: Problem 9 Statistics for Business and Economics 12
Blogs for Fortune 500 firms. Web site communication through blogs and forums is becoming a key marketing tool for companies. The Journal of Relationship Marketing (Vol. 7, 2008) investigated the prevalence of blogs and forums at Fortune 500 firms with both English and Chinese web sites. Of the firms that provided blogs/forums as a marketing tool, the accompanying table gives a breakdown on the entity responsible for creating the blogs/forums. Use a graphical method to describe the data summarized in the table. Interpret the graph.
Read more -
Chapter 2: Problem 13 Statistics for Business and Economics 12
Problem 13E Motivation and right-oriented bias. Evolutionary theory suggests that motivated decision makers tend to exhibit a right-oriented bias. (For example, if presented with two equally valued brands of detergent on a supermarket shelf, consumers are more likely to choose the brand on the right.) In Psychological Science (November 2011), researchers tested this theory using data on all penalty shots attempted in World Cup soccer matches (a total of 204 penalty shots). The researchers believed that goalkeepers, motivated to make a penalty-shot save but with little time to make a decision, would tend to dive to the right. The results of the study (percentages of dives to the left, middle, or right) are provided in the table. Note that the percentages in each row, corresponding to a certain match situation, add to 100%. Construct sideby- side bar graphs showing the distribution of dives for the three match situations. What inferences can you draw from the graphs? Match Situation Dive Left Stay Middle Dive Right Team behind 29% 0% 71% Tied 48% 3% 49% Team ahead 51% 1% 48% Source: Based on M. Roskes, et al., “The right side? Under time pressure, approach motivation leads to right-oriented bias,” PSYCHOLOGICAL SCIENCE, Vol. 22, No. 11, November 2011 (adapted from Figure 2).
Read more -
Chapter 2: Problem 12 Statistics for Business and Economics 12
Problem 12E History of corporate acquisitions. A corporate acquisition occurs when one corporation purchases all the stock shares of another, essentially taking over the other. The Academy of Management Journal (Aug. 2008) investigated the performance and timing of corporate acquisitions for a large sample of firms over the years 1980 to 2000. The accompanying data table gives the number of firms sampled and number that announced one or more acquisitions during the years 1980, 1990, and 2000. Construct side-by-side bar charts to describe the firms with and without acquisitions in the 3 years. Compare and contrast the bar charts. Source: Data from D. N. Iyer and K. D. Miller, “Performance feedback, slack, and the timing of acquisitions,” ACADEMY OF MANAGEMENT JOURNAL, Vol. 51, No. 4, August 2008, pp. 808–822, Table 1.
Read more -
Chapter 2: Problem 14 Statistics for Business and Economics 12
Problem 14E Museum management. What criteria do museums use to evaluate their performance? In a worldwide survey reported in Museum Management and Curatorship (June 2010), managers of 30 leading museums of contemporary art were asked to provide the performance measure used most often. A summary of the results is provided in the table. The researcher concluded that “there is a large amount of variation within the museum community with regard to . . . performance measurement and evaluation.” Do you agree? Use a graph to support your conclusion. Performance Measure Number of Museums Total visitors 8 Paying visitors 5 Big shows 6 Funds raised 7 Members 4
Read more -
Chapter 2: Problem 15 Statistics for Business and Economics 12
Problem 15E Advertising with reader-response cards. “Reader-response cards” are used by marketers to advertise their product and obtain sales leads. These cards are placed in magazines and trade publications. Readers detach and mail in the cards to indicate their interest in the product, expecting literature or a phone call in return. How effective are these cards (called “bingo cards” in the industry) as a marketing tool? Performark, a Minneapolis business that helps companies close on sales leads, attempted to answer this question by responding to 17,000 card-advertisements placed by industrial marketers in a wide variety of trade publications over a 6-year period. Performark kept track of how long it took for each advertiser to respond. A summary of the response times is given in the following table. Advertiser’s Response Time Percentage Never responded 21 13–59 days 33 60–120 days 34 More than 120 days 12 Total 100 a. Describe the variable measured by Performark. b. These results were displayed in the form of a pie chart. Reconstruct the pie chart from the information given in the table. c. How many of the 17,000 advertisers never responded to the sales lead? d. Advertisers typically spend at least a million dollars on a reader-response card marketing campaign. Many industrial marketers feel these “bingo cards” are not worth their expense. Does the information in the pie chart, part b, support this contention? Explain why or why not. If not, what information can be gleaned from the pie chart to help potential “bingo card” campaigns?
Read more -
Chapter 2: Problem 18 Statistics for Business and Economics 12
Problem 18E Graph the relative frequency histogram for the 500 measurements summarized in the accompanying relative frequency table. Measurement Class Relative Frequency .5–2.5 .10 2.5–4.5 .15 4.5–6.5 .25 6.5–8.5 .20 8.5–10.5 .05 10.5–12.5 .10 12.5–14.5 .10 14.5–16.5 .05
Read more -
Chapter 2: Problem 17 Statistics for Business and Economics 12
Problem 17E Groundwater contamination in wells. In New Hampshire, about half the counties mandate the use of reformulated gasoline. This has led to an increase in the contamination of groundwater with methyl tert-butyl ether (MTBE). Environmental Science & Technology (Jan. 2005) reported on the factors related to MTBE contamination in public and private New Hampshire wells. Data were collected for a sample of 223 wells. Three of the variables are qualitative in nature: well class (public or private), aquifer (bedrock or unconsolidated), and detectible level of MTBE (below limit or detect). [Note: A detectible level of MTBE occurs if the MTBE value exceeds .2 micrograms per liter.] The data for 11 selected wells are shown in the accompanying table. Well Class Aquifer Detect MTBE Private Bedrock Below Limit Private Bedrock Below Limit Public Unconsolidated Detect Public Unconsolidated Below Limit Public Unconsolidated Below Limit Public Unconsolidated Below Limit Public Unconsolidated Detect Public Unconsolidated Below Limit Public Unconsolidated Below Limit Public Bedrock Detect Public Bedrock Detect Source: Based on Ayotte, J. D., Argue, D. M., and McGarry, F. J. “Methyl tert-Butyl Ether Occurrence and Related Factors in Public and Private Wells in Southeast New Hampshire.” ENVIRONMENTAL SCIENCE & TECHNOLOGY, Vol. 39, No. 1, Jan. 2005, pp. 9–16. a. Use graphical methods to describe each of the three qualitative variables for all 223 wells. b. Use side-by-side bar charts to compare the proportions of contaminated wells for private and public well classes. c. Use side-by-side bar charts to compare the proportions of contaminated wells for bedrock and unconsolidated aquifers. d. What inferences can be made from the bar charts, parts a–c?
Read more -
Chapter 2: Problem 20 Statistics for Business and Economics 12
Problem 20E Consider the stem-and-leaf display shown here. Stem Leaf 5 1 4 457 3 00036 2 1134599 1 2248 0 012 a. How many observations were in the original data set? b. In the bottom row of the stem-and-leaf display, identify the stem, the leaves, and the numbers in the original data set represented by this stem and its leaves. c. Re-create all the numbers in the data set and construct a dot plot.
Read more -
Chapter 2: Problem 19 Statistics for Business and Economics 12
Problem 19E Refer to Exercise 2.18. Calculate the number of the 500 measurements falling into each of the measurement classes. Then graph a frequency histogram for these data. 2.18 Graph the relative frequency histogram for the 500 measurements summarized in the accompanying relative frequency table. Measurement Class Relative Frequency .5–2.5 .10 2.5–4.5 .15 4.5–6.5 .25 6.5–8.5 .20 8.5–10.5 .05 10.5–12.5 .10 12.5–14.5 .10 14.5–16.5 .05
Read more -
Chapter 2: Problem 16 Statistics for Business and Economics 12
Problem 16E Stewardship at MBA programs. Business Ethics (Fall 2005) reported on a survey designed to rank master in business administration (MBA) programs worldwide on how well they prepare students for social and environmental stewardship. Each business school was ranked according to four criteria: student exposure (class time dedicated to social and environmental issues), student opportunity (courses with social and environmental content), course content (courses emphasize business as a force for positive social and environmental change), and faculty research (published articles that examine business in a social/ environmental context). Each area was rated from 1 star (lowest rating) to 5 stars (highest rating). Overall, Stanford University received the top ranking, followed by ESADE (Spain), York University (Canada), Monterrey Technical Institute (Mexico), and the University of Notre Dame. A summary of the rankings (star ratings) for the top 30 MBA programs is shown in the table. Source: Data from Stewardship at MBA programs, D. Biello, “MBA Programs for Social and Environmental Stewardship,” BUSINESS ETHICS, Fall 2005, p. 25. a. Illustrate the differences and similarities of the star-ranking distributions for the four different criteria. b. Give a plausible reason why there were no 1-star ratings for the 30 MBA programs.
Read more -
Chapter 2: Problem 21 Statistics for Business and Economics 12
Minitab was used to generate the following histogram: a. Is this a frequency histogram or a relative frequency histogram? Explain. b. How many measurement classes were used in the construction of this histogram? c. How many measurements are in the data set described by this histogram?
Read more -
Chapter 2: Problem 23 Statistics for Business and Economics 12
Problem 23E Corporate sustainability of CPA firms. Refer to the Business and Society (March 2011) study on the sustainability behaviors of CPA corporations, Exercise 1.26 (p. 27). Corporate sustainability, recall, refers to business practices designed around social and environmental considerations. Data on the level of support for corporate sustainability were obtained for 992 senior managers. Level of support was measured quantitatively. Simulation was used to convert the data from the study to a scale ranging from 0 to 160 points, where higher point values indicate a higher level of support for sustainability. a. A histogram for level of support for sustainability is shown next. What type of histogram is produced, frequency or relative frequency? b. Use the graph to estimate the percentage of the 992 senior managers who reported a high (100 points or greater) level of support for corporate sustainability. 1.26 Corporate sustainability and firm characteristics. Corporate sustainability refers to business practices designed around social and environmental considerations (e.g., “going green”). Business and Society (March 2011) published a paper on how firm size and firm type impact sustainability behaviors. The researchers added questions on sustainability to a quarterly survey of Certified Public Accountants (CPAs). The survey was sent to approximately 23,500 senior managers at CPA firms, of which 1,293 senior managers responded. (Note: It is not clear how the 23,500 senior managers were selected.) Due to missing data (incomplete survey answers), only 992 surveys were analyzed. These data were used to infer whether larger firms are more likely to report sustainability policies than smaller firms and whether public firms are more likely to report sustainability policies than private firms. a. Identify the population of interest to the researchers. b. What method was used to collect the sample data? c. Comment on the representativeness of the sample. d. How will your answer to part c impact the validity of the inferences drawn from the study?
Read more -
Chapter 2: Problem 22 Statistics for Business and Economics 12
Problem 22E Annual survey of computer crimes. Refer to the 2010 CSI Computer Crime and Security Survey, Exercise 1.22 (p. 26). Recall that 351 organizations responded on unauthorized use of computer systems. One of the survey questions asked respondents to indicate the percentage of monetary losses attributable to malicious actions by individuals within the organization (i.e., malicious insider actions). The following XLSTAT histogram summarizes the data for the 144 firms who experienced some monetary loss due to malicious insider actions. a. Which measurement class contains the highest proportion of respondents? b. What is the approximate proportion of the 144 organizations that reported a percentage monetary loss from malicious insider actions less than 20%? c. What is the approximate proportion of the 144 organizations that reported a percentage monetary loss from malicious insider actions greater than 60%? d. About how many of the 144 organizations reported a percentage monetary loss from malicious insider actions between 20% and 30%? 1.22 Annual survey of computer crimes. The Computer Security Institute (CSI) conducts an annual survey of computer crime at U.S. businesses. CSI sends survey questionnaries to computer security personnel at all U.S. corporations and government agencies. The 2010 CSI survey was sent by post or e-mail to 5,412 firms, and 351 organizations responded. Forty-one percent of the respondents admitted unauthorized use of computer systems at their firms during the year. (CSI Computer Crime and Security Survey, 2010/2011) a. Identify the population of interest to CSI. b. Identify the data-collection method used by CSI. Are there any potential biases in the method used? c. Describe the variable measured in the CSI survey. Is it quantitative or qualitative? d. What inference can be made from the study result?
Read more -
Chapter 2: Problem 24 Statistics for Business and Economics 12
Problem 24E Sanitation inspection of cruise ships. To minimize the potential for gastrointestinal disease outbreaks, all passenger cruise ships arriving at U.S. ports are subject to unannounced sanitation inspections. Ships are rated on a 100-point scale by the Centers for Disease Control and Prevention. A score of 86 or higher indicates that the ship is providing an accepted standard of sanitation. The latest (as of Jan. 2010) sanitation scores for 186 cruise ships are saved in the SHIPSANIT file. The first five and last five observations in the data set are listed in the following table: Ship Name Sanitation Score Adventure of the Seas 98 AID Aaura 100 Albatross 69 Amadea 84 Amsterdam 99 ? ? Westerdam 99 Wind Spirit 97 Wind Surf 95 Zaandam 99 Zuiderdam 95 Based on National Center for Environmental Health, Centers for Disease Control and Prevention, Jan. 6, 2010. a. Generate a stem-and-leaf display of the data. Identify the stems and leaves of the graph. ________________ b. Use the stem-and-leaf display to estimate the proportion of ships that have an accepted sanitation standard. ________________ c. Locate the inspection score of 69 (Albatrass) on the stem-and-leaf display.
Read more -
Chapter 2: Problem 25 Statistics for Business and Economics 12
History of corporate acquisitions. Refer to the Academy of Management Journal (Aug. 2008) study of corporate acquisitions from 1980 to 2000, Exercise 2.12 (p. 50). The data file includes the number of firms with at least one acquisition each year. a. Construct either a dot plot or a stem-and-leaf display for the annual number of firms with at least one acquisition. b. On the graph, part a, highlight (or circle) the values for the years 1996–2000. Do you detect a pattern? If so, what conclusion can you draw from the data? 2.12 History of corporate acquisitions. A corporate acquisition occurs when one corporation purchases all the stock shares of another, essentially taking over the other. The Academy of Management Journal (Aug. 2008) investigated the performance and timing of corporate acquisitions for a large sample of firms over the years 1980 to 2000. The accompanying data table gives the number of firms sampled and number that announced one or more acquisitions during the years 1980, 1990, and 2000. Construct side-by-side bar charts to describe the firms with and without acquisitions in the 3 years. Compare and contrast the bar charts.
Read more -
Chapter 2: Problem 29 Statistics for Business and Economics 12
Problem 29E Crude oil biodegradation. In order to protect their valuable resources, oil companies spend millions of dollars researching ways to prevent biodegradation of crude Dioxide Amount Crude Oil Present 3.3 No 0.5 Yes 1.3 Yes 0.4 Yes 0.1 No 4.0 No 0.3 No 0.2 Yes 2.4 No 2.4 No 1.4 No 0.5 Yes 0.2 Yes 4.0 No 4.0 No 4.0 No Source: Based on A. Permanyer, J. L. R. Gallego, M. A. Caja, and D. Dessort, “Crude Oil Biodegradation and Environmental Factors at the Riutort Oil Shale Mine, SE Pyrenees.” JOURNAL OF PETROLEUM GEOLOGY, Vol. 33, No. 2, April 2010, Table 1. oil. The Journal of Petroleum Geology (April 2010) published a study of the environmental factors associated with biodegradation in crude oil reservoirs. Sixteen water specimens were randomly selected from various locations in a reservoir on the floor of a mine. Two of the variables measured were (1) the amount of dioxide (milligrams/liter) present in the water specimen and (2) whether or not oil was present in the water specimen. These data are listed in the accompanying table in the left column. Construct a stem-and-leaf display for the dioxide data. Locate the dioxide levels associated with water specimens that contain oil. Highlight these data points on the stem-and-leaf display. Is there a tendency for crude oil to be present in water with lower levels of dioxide?
Read more -
Chapter 2: Problem 28 Statistics for Business and Economics 12
Problem 28E Items arriving and departing a work center. In a manufacturing plant, a work center is a specific production facility that consists of one or more people and/or machines and is treated as one unit for the purposes of capacity requirements for planning and job scheduling. If jobs arrive at a particular work center at a faster rate than they depart, the work center impedes the overall production process and is referred to as a bottleneck. The data in the table at the bottom of the page were collected by an operations manager for use in investigating a potential bottleneck work center. Construct dot plots for the two sets of data. Do the dot plots suggest that the work center may be a bottleneck? Explain.
Read more -
Chapter 2: Problem 31 Statistics for Business and Economics 12
Problem 31E Doctors and ethics. Refer to the Journal of Medical Ethics (Vol. 32, 2006) study of physicians’ use of ethics consultation, Exercise 2.11 (p. 49). In addition to the qualitative variable, use of ethics consultation in the future (“yes” or “no”), one of the quantitative variables measured in the survey of physicians was length of time in practice (i.e., years of experience). The medical researchers hypothesized that older, more experienced physicians would be less likely to use ethics consultation in the future. Access the file and generate two graphs to describe the distribution of years of experience—one for physicians who indicated they would use ethics consultation in the future and one for physicians who refused to use ethics consultation. Place the graphs side by side. Is there support for the researchers’ assertion? Explain. 2.11 Doctors and ethics. For physicians confronted with ethical dilemmas (e.g., end-of-life issues or treatment of patients without insurance), many hospitals provide ethics consultation services. However, not all physicians take advantage of these services and some refuse to use ethics consultation. The extent to which doctors refuse ethics consults was studied in the Journal of Medical Ethics (Vol. 32, 2006). Survey questionnaires were administered to all physicians on staff at a large community hospital in Tampa, Florida, and 118 physicians responded. Several qualitative variables were measured, including previous use of ethics consultation (“never used” or “used at least once”), practitioner specialty (“medical” or “surgical”), and future use of ethics consultation (“yes” or “no”). a. Access the file and generate a graph that describes the level to which the physicians on staff have previously used the ethics consultation services. What proportion of the sampled physicians have never used ethics consultation? b. Repeat part a for future use of ethics consultation. What proportion of the sampled physicians state that they will not use the services in the future? c. Generate side-by-side graphs that illustrate differences in previous use of ethics consultation by medical and surgical specialists. What inference can you make from the graphs? d. Repeat part c for future use of ethics consultation.
Read more -
Chapter 2: Problem 27 Statistics for Business and Economics 12
Problem 27E State SAT scores. Educators are constantly evaluating the efficacy of public schools in the education and training of American students. One quantitative assessment of change over time is the difference in scores on the SAT, which has been used for decades by colleges and universities as one criterion for admission. Originally, the SAT provided scores in reading and mathematics. Now, three scores are provided: reading, mathematics, and critical writing. SAT scores for each of the 50 states and District of Columbia for the years 2011, 2010, and 2001 are saved in the accompanying file. Data for the first five and last two states are shown in the second table below. a. Use graphs to display the SAT mathematics score distributions in 2011 and 2010. How did the distributions of state scores change over the year? b. Repeat part a, but compare the distribution in 2011 with the one in 2001. How did the distributions of state scores change over the past 10 years? . As another method of comparing the 2011 and 2001 SAT mathematics scores, compute the paired difference by subtracting the 2001 score from the 2011 score for each state. Summarize these differences with a graph. Compare the results to those of part b. d. Based on the graph, part c, what is the largest improvement in SAT mathematics score? Identify the state associated with this improvement.
Read more -
Chapter 2: Problem 26 Statistics for Business and Economics 12
Problem 26E Most valuable NFL teams. Each year Forbes reports on the value of all teams in the National Football League. Although England’s soccer team, Manchester United, is the most valuable team in the world ($1.8 billion), the NFL now has 15 teams worth at least $1 billion. For 2011, Forbes reports that the Dallas Cowboys are the most valuable team in the NFL, worth $1.85 billion. The current values (in $ millions) of all 32 NFL teams, as well as the percentage changes in values from 2010 to 2011, debt-to-value ratios, annual revenues, and operating incomes are listed in the first table below. a. Use a graph to describe the distribution of current values for the 32 NFL teams. b. Use a graph to describe the distribution of the 1-year change in current value for the 32 NFL teams. c. Use a graph to describe the distribution of debt-tovalue ratios for the 32 NFL teams. d. Use a graph to describe the distribution of the annual revenues for the 32 NFL teams. e. Use a graph to describe the distribution of operating incomes for the 32 NFL teams. f. Compare and contrast the graphs, parts a–e.
Read more -
Chapter 2: Problem 34 Statistics for Business and Economics 12
Problem 34E Made-to-order delivery times. Production processes may be classified as make-to-stock processes or make-to-order processes. Make-to-stock processes are designed to produce a standardized product that can be sold to customers from the firm’s inventory. Make-to-order processes are designed to produce products according to customer specifications (Schroeder, Operations Management, 2008). In general, performance of make-to-order processes is measured by delivery time—the time from receipt of an order until the product is delivered to the customer. The accompanying data set is a sample of delivery times (in days) for a particular make-to-order firm last year. The delivery times marked by an asterisk are associated with customers who subsequently placed additional orders with the firm. Concerned that they are losing potential repeat customers because of long delivery times, the management would like to establish a guideline for the maximum tolerable delivery time. Use a graphical method to help suggest a guideline. Explain your reasoning.
Read more -
Chapter 2: Problem 35 Statistics for Business and Economics 12
Problem 35E Calculate the mean and median of the following grade point averages: 3.2 2.5 2.1 3.7 2.8 2.0
Read more -
Chapter 2: Problem 32 Statistics for Business and Economics 12
Problem 32E Time in bankruptcy. Financially distressed firms can gain protection from their creditors while they restructure by filing for protection under U.S. Bankruptcy Codes. In a prepackaged bankruptcy, a firm negotiates a reorganization plan with its creditors prior to filing for bankruptcy. This can result in a much quicker exit from bankruptcy than tradional bankruptcy filings. A study of 49 prepackaged bankruptcies was published in Financial Management (Spring, 1995). For each firm, information was collected on the time (in months) in bankruptcy as well as the results of the board of directors’ vote on the type of reorganization plan. Three types of plans were studied: “Joint”—a joint exachange offer with prepackaged bankruptcy solicitation; “Prepack”—prepackaged bankruptcy solicitation only; and “None”—no pre-filing vote held. The data for the 49 firms is provided in the accompanying table. a. Construct a stem-and-leaf display for the length of time in bankruptcy for all 49 companies. b. Summarize the information reflected in the stem-and-leaf display from part a. Make a general statement about the length of time in bankruptcy for firms using “prepacks.” c. Select a graphical method that will permit a comparison of the time-in-bankruptcy distributions for the three types or reorganization plans. d. Firms that were reorganized through a leveraged buyout are identified by an asterisk in the table. Mark these firms on the stem-and-leaf display, part a, by circling their bankruptcy times. Do you observe any pattern in the graph? Explain.
Read more -
Chapter 2: Problem 33 Statistics for Business and Economics 12
Phishing attacks to e-mail accounts. Phishing is the term used to describe an attempt to extract personal/financial information (e.g., PIN numbers, credit card information, bank account numbers) from unsuspecting people through fraudulent e-mail. An article in Chance (Summer 2007) demonstrates how statistics can help identify phishing attempts and make e-commerce safer. Data from an actual phishing attack against an organization were used to determine whether the attack may have been an “inside job” that originated within the company. The company set up a publicized e-mail account—called a “fraud box”—which enabled employees to notify it if they suspected an e-mail phishing attack. The interarrival times, i.e., the time differences (in seconds), for 267 fraud box e-mail notifications were recorded. Researchers showed that if there is minimal or no collaboration or collusion from within the company, the interarrival times would have a frequency distribution similar to the one shown in the accompanying figure. The 267 interarrival times are saved in the PHISHING file. Construct a frequency histogram for the interarrival times. Give your opinion on whether the phishing attack against the organization was an “inside job.”
Read more -
Chapter 2: Problem 36 Statistics for Business and Economics 12
Calculate the mean for samples where \(a.\ \ n=10,\ \Sigma x=85\) \(b.\ \ n=16,\ \Sigma x=400\) \(c.\ \ n=45,\ \Sigma x=35\) \(d.\ \ n=18,\ \Sigma x=242\)
Read more -
Chapter 2: Problem 39 Statistics for Business and Economics 12
Calculate the mode, mean, and median of the following data: 18 10 15 13 17 15 12 15 18 16 11
Read more -
Chapter 2: Problem 37 Statistics for Business and Economics 12
Problem 37E Explain how the relationship between the mean and median provides information about the symmetry or skewness of the data’s distribution.
Read more -
Chapter 2: Problem 40 Statistics for Business and Economics 12
Problem 40E Calculate the mean, median, and mode for each of the following samples: a. 7, -2, 3, 3, 0, 4 b. 2, 3, 5, 3, 2, 3, 4, 3, 5, 1, 2, 3, 4 c. 51, 50, 47, 50, 48, 41, 59, 68, 45, 37
Read more -
Chapter 2: Problem 41 Statistics for Business and Economics 12
Problem 41E Describe how the mean compares to the median for a distribution as follows: a. Skewed to the left b. Skewed to the right c. Symmetric
Read more -
Chapter 2: Problem 38 Statistics for Business and Economics 12
Explain the difference between the calculation of the median for an odd and an even number of measurements. Construct one data set consisting of five measurements and another consisting of six measurements for which the medians are equal.
Read more -
Chapter 2: Problem 44 Statistics for Business and Economics 12
Problem 44E Surface roughness of oil field pipe. Oil field pipes are internally coated in order to prevent corrosion. Researchers at the University of Louisiana, Lafayette, investigated the influence that coating may have on the surface roughness of oil field pipes (Anti-corrosion Methods and Materials, Vol. 50, 2003). A scanning probe instrument was used to measure the surface roughness of each in a sample of 20 sections of coated interior pipe. The data (in micrometers) are provided in the table. 1.72 2.50 2.16 2.13 1.06 2.24 2.31 2.03 1.09 1.40 2.57 2.64 1.26 2.05 1.19 2.13 1.27 1.51 2.41 1.95 Source: Farshed, F., & Pesacreta, T. “Coated pipe interior surface roughness as measured by three scanning probe instruments.” Anti-corrosion Methods and Materials. Vol. 50, No. 1, 2003 (Table III). a. Find and interpret the mean of the sample b. Find and interpret the median of the sample. c. Which measure of central tendency—the mean or the median—best describes the surface roughness of the sampled pipe sections? Explain.
Read more -
Chapter 2: Problem 30 Statistics for Business and Economics 12
Is honey a cough remedy? Coughing at night is a common symptom of an upper respiratory tract infection, yet there is no accepted therapeutic cure. Does a teaspoon of honey before bed really calm a child’s cough? To test the folk remedy, pediatric researchers at Pennsylvania State University carried out a designed study conducted over two nights (Archives of Pediatrics and Adolescent Medicine, Dec. 2007). A sample of 105 children who were ill with an upper respiratory tract infection and their parents participated in the study. On the first night, the parents rated their children’s cough symptoms on a scale from 0 (no problems at all) to 6 (extremely severe) in five different areas. The total symptoms score (ranging from 0 to 30 points) was the variable of interest for the 105 patients. On the second night, the parents were instructed to give their sick child a dosage of liquid “medicine” prior to bedtime. Unknown to the parents, some were given a dosage of dextromethorphan (DM)—an over-the-counter cough medicine—while others were given a similar dose of honey. Also, a third group of parents (the control group) gave their sick children no dosage at all. Again, the parents rated their children’s cough symptoms, and the improvement in total cough symptoms score was determined for each child. The data (improvement scores) for the study are shown in the table on the next page, followed by a Minitab dot plot of the data. Notice that the green dots represent the children who received a dose of honey, the red dots represent those who got the DM dosage, and the black dots represent the children in the control group. What conclusions can pediatric researchers draw from the graph? Do you agree with the statement (extracted from the article), “Honey may be a preferable treatment for the cough and sleep difficulty associated with childhood upper respiratory tract infection”?
Read more -
Chapter 2: Problem 42 Statistics for Business and Economics 12
Performance of stock screeners. Investment companies provide their clients with automated tools—called stock screeners—to help them select a portfolio of stocks to invest in. The American Association of Individual Investors (AAII) provides statistics on stock screeners at its Web site, www.aaii.com. The next table lists the annualized percentage return on investment (as compared to the Standard & Poor’s 500 Index) for 13 randomly selected stock screeners. (Note: A negative annualized return reflects a stock portfolio that performed worse than the S&P 500.) 9.0 -.1 -1.6 14.6 16.0 7.7 19.9 9.8 3.2 24.8 17.6 10.7 9.1 a. Compute the mean for the data set. Interpret its value. b. Compute the median for the data set. Interpret its value.
Read more -
Chapter 2: Problem 45 Statistics for Business and Economics 12
Top research universities. Each year, the Center for Measuring University Performance produces a report on America’s top research universities. The total expenditures (in thousands of dollars) for research for the top 20 ranked universities from the 2010 Annual Report are listed in the table. a. Find the mean of the research expenditures for the top 20 ranked universities. Interpret this value. b. Find the median of the research expenditures for the top 20 ranked universities. Interpret this value. c. Consider a university president who is interested in the distribution of research expenditures of all American universities. Would the mean, part a, be a good measure of the center of this distribution? Explain.
Read more -
Chapter 2: Problem 43 Statistics for Business and Economics 12
U.S. wine export markets. The data in the next table, compiled by the Center for International Trade Development (CITD), provide a listing of the top 30 U.S. export markets for sparkling wines. Descriptive statistics for the amount exported (thousands of dollars) and 3-year percentage change for the 30 countries are shown in the Minitab printout below. a. Locate the mean amount exported on the printout and practically interpret its value. b. Locate the median amount exported on the printout and practically interpret its value. c. Locate the mean 3-year percentage change on the printout and practically interpret its value. d. Locate the median 3-year percentage change on the printout and practically interpret its value.
Read more -
Chapter 2: Problem 46 Statistics for Business and Economics 12
Corporate sustainability of CPA firms. Refer to the Business and Society (March 2011) study on the sustainability behaviors of CPA corporations, Exercise 2.23 (p. 59). Recall that the level of support for corporate sustainability (measured on a quantitative scale ranging from 0 to 160 points) was obtained for each 992 senior managers at CPA firms. Numerical measures of central tendency for level of support are shown in the accompanying Minitab printout. a. Locate the mean on the printout. Comment on the accuracy of the statement: “On average, the level of support for corporate sustainability for the 992 senior managers was 67.76 points.” b. Locate the median on the printout. Comment on the accuracy of the statement: “Half of the 992 senior managers reported a level of support for corporate sustainability below 68 points.” c. Locate the mode on the printout. Comment on the accuracy of the statement: “Most of the 992 senior managers reported a level of support for corporate sustainability below 64 points.” d. Based on the values of the measures of central tendency, make a statement about the type of skewness (if any) that exists in the distribution of 992 support levels. Check your answer by examining the histogram shown in Exercise 2.23.
Read more -
Chapter 2: Problem 47 Statistics for Business and Economics 12
Problem 47E Is honey a cough remedy? Refer to the Archives of Pediatrics and Adolescent Medicine (Dec. 2007) study of honey as a remedy for coughing, Exercise 2.30 (p. 61). Recall that the 105 ill children in the sample were randomly divided into three groups: those who received a dosage of an over-the-counter cough medicine (DM), those who received a dosage of honey (H), and those who received no dosage (control group). The coughing improvement scores (as determined by the children’s parents) for the patients are reproduced in the accompanying table. b. Find the median improvement score for the DM dosage group. c. Find the median improvement score for the control group. d. Based on the results, parts a–c, what conclusions can pediatric researchers draw? (We show how to support these conclusions with a measure of reliability in subsequent chapters.) 2.30 Is honey a cough remedy? Coughing at night is a common symptom of an upper respiratory tract infection, yet there is no accepted therapeutic cure. Does a teaspoon of honey before bed really calm a child’s cough? To test the folk remedy, pediatric researchers at Pennsylvania State University carried out a designed study conducted over two nights (Archives of Pediatrics and Adolescent Medicine, Dec. 2007). A sample of 105 children who were ill with an upper respiratory tract infection and their parents participated in the study. On the first night, the parents rated their children’s cough symptoms on a scale from 0 (no problems at all) to 6 (extremely severe) in five different areas. The total symptoms score (ranging from 0 to 30 points) was the variable of interest for the 105 patients. On the second night, the parents were instructed to give their sick child a dosage of liquid “medicine” prior to bedtime. Unknown to the parents, some were given a dosage of dextromethorphan (DM)—an over-the-counter cough medicine—while others were given a similar dose of honey. Also, a third group of parents (the control group) gave their sick children no dosage at all. Again, the parents rated their children’s cough symptoms, and the improvement in total cough symptoms score was determined for each child. The data (improvement scores) for the study are shown in the table on the next page, followed by a Minitab dot plot of the data. Notice that the green dots represent the children who received a dose of honey, the red dots represent those who got the DM dosage, and the black dots represent the children in the control group. What conclusions can pediatric researchers draw from the graph? Do you agree with the statement (extracted from the article), “Honey may be a preferable treatment for the cough and sleep difficulty associated with childhood upper respiratory tract infection”?
Read more -
Chapter 2: Problem 51 Statistics for Business and Economics 12
Semester hours taken by CPA candidates. In order to become a certified public accountant (CPA), you must pass the Uniform CPA Exam. Many states require a minimum of 150 semester hours of college education before a candidate can sit for the CPA exam. However, traditionally, colleges only require 128 semester hours for an undergraduate degree. A study of whether the “extra” 22 hours of college credit is warranted for CPA candidates was published in the Journal of Accounting and Public Policy (Spring 2002). For one aspect of the study, researchers sampled over 100,000 first-time candidates for the CPA exam and recorded the total semester hours of college credit for each candidate. The mean and median for the data set were 141.31 and 140 hours, respectively. Interpret these values. Make a statement about the type of skewness, if any, that exists in the distribution of total semester hours.
Read more -
Chapter 2: Problem 48 Statistics for Business and Economics 12
Crude oil biodegradation. Refer to the Journal of Petroleum Geology (April 2010) study of the environmental factors associated with biodegradation in crude oil reservoirs, Exercise 2.29 (p. 61). Recall that the amount of dioxide (milligrams/liter) and presence/absence of crude oil was determined for each of 16 water specimens collected from a mine reservoir. The data are repeated in the accompanying table. a. Find the mean dioxide level of the 16 water specimens. Interpret this value. b. Find the median dioxide level of the 16 water specimens. Interpret this value. c. Find the mode of the 16 dioxide levels. Interpret this value. d. Find the median dioxide level of the 10 water specimens with no crude oil present. e. Find the median dioxide level of the 6 water specimens with crude oil present. f. Compare the results, parts d and e. Make a statement about the association between dioxide level and presence/ absence of crude oil.
Read more -
Chapter 2: Problem 52 Statistics for Business and Economics 12
Problem 52E Doctors and ethics. Refer to the Journal of Medical Ethics (Vol. 32, 2006) study of physicians’ use of ethics consultation, Exercise 2.31 (p. 62). In addition to the qualitative variable, use of ethics consultation in the future (“yes” or “no”), one of the quantitative variables measured in the survey of physicians was length of time in practice (i.e., years of experience). Recall that the medical researchers hypothesized that physicians who refused to use ethics consultation in the future would tend to be older, more experienced physicians. a. Access the data file and find the mean, median, and mode for the length of time in practice (i.e., years of experience) variable. Give a practical interpretation of each of these measures of central tendency. b. Consider only the physicians who would refuse to use ethics consultation in the future. Find the mean, median, and mode for the length of time in practice for these physicians. Practically interpret the results. c. Repeat part b for physicians who would use ethics consultation in the future. d. Use the results, parts b and c, to comment on the medical researchers’ theory. 2.31 Doctors and ethics. Refer to the Journal of Medical Ethics (Vol. 32, 2006) study of physicians’ use of ethics consultation, Exercise 2.11 (p. 49). In addition to the qualitative variable, use of ethics consultation in the future (“yes” or “no”), one of the quantitative variables measured in the survey of physicians was length of time in practice (i.e., years of experience). The medical researchers hypothesized that older, more experienced physicians would be less likely to use ethics consultation in the future. Access the file and generate two graphs to describe the distribution of years of experience—one for physicians who indicated they would use ethics consultation in the future and one for physicians who refused to use ethics consultation. Place the graphs side by side. Is there support for the researchers’ assertion? Explain. 2.11 Doctors and ethics. For physicians confronted with ethical dilemmas (e.g., end-of-life issues or treatment of patients without insurance), many hospitals provide ethics consultation services. However, not all physicians take advantage of these services and some refuse to use ethics consultation. The extent to which doctors refuse ethics consults was studied in the Journal of Medical Ethics (Vol. 32, 2006). Survey questionnaires were administered to all physicians on staff at a large community hospital in Tampa, Florida, and 118 physicians responded. Several qualitative variables were measured, including previous use of ethics consultation (“never used” or “used at least once”), practitioner specialty (“medical” or “surgical”), and future use of ethics consultation (“yes” or “no”). a. Access the file and generate a graph that describes the level to which the physicians on staff have previously used the ethics consultation services. What proportion of the sampled physicians have never used ethics consultation? b. Repeat part a for future use of ethics consultation. What proportion of the sampled physicians state that they will not use the services in the future? c. Generate side-by-side graphs that illustrate differences in previous use of ethics consultation by medical and surgical specialists. What inference can you make from the graphs? d. Repeat part c for future use of ethics consultation.
Read more -
Chapter 2: Problem 50 Statistics for Business and Economics 12
Problem 50E Ranking driving performance of professional golfers. A group of Northeastern University researchers developed a new method for ranking the total driving performance of golfers on the Professional Golf Association (PGA) tour (The Sport Journal, Winter 2007). The method requires knowing a golfer’s average driving distance (yards) and driving accuracy (percent of drives that land in the fairway). The values of these two variables are used to compute a driving performance index. Data for the top 40 PGA golfers (as ranked by the new method) are saved in the accompanying file. The first five and last five observations are listed in the table below. Rank Player DrivingDistance(yards) DrivingAccuracy(%) DrivingPerformanceIndex 1 Woods 316.1 54.6 3.58 2 Perry 304.7 63.4 3.48 3 Gutschewski 310.5 57.9 3.27 4 Wetterich 311.7 56.6 3.18 5 Hearn 295.2 68.5 2.82 : : : : : 36 Senden 291 66 1.31 37 Mickelson 300 58.7 1.30 38 Watney 298.9 59.4 1.26 39 Trahan 295.8 61.8 1.23 40 Pappas 309.4 50.6 1.17 Source: Based on Frederick Wiseman, Ph.D., Mohamed Habibullah, Ph.D., and Mustafa Yilmaz, Ph.D, “Ranking Driving Performance on the PGA Tour.” SPORTS JOURNAL, Vol. 10, No. 1, Winter 2007 (Table 2). a. Find the mean, median, and mode for the 40 driving performance index values. b. Interpret each of the measures of central tendency, part a. c. Use the results, part a, to make a statement about the type of skewness in the distribution of driving performance indexes. Support your statement with a graph.
Read more -
Chapter 2: Problem 53 Statistics for Business and Economics 12
Problem 53E Time in bankruptcy. Refer to the Financial Management (Spring 1995) study of prepackaged bankruptcy filings, Exercise 2.32 (p. 62). Recall that each of 49 firms that negotiated a reorganization plan with its creditors prior to filing for bankruptcy was classified in one of three categories: joint exchange offer with prepack, prepack solicitation only, and no prefiling vote held. Consider the quantitative variable length of time in bankruptcy (months) saved in the accompanying file. Is it reasonable to use a single number (e.g., mean or median) to describe the center of the timein- bankruptcy distributions? Or should three “centers” be calculated, one for each of the three categories of prepack firms? Explain. 2.32 Time in bankruptcy. Financially distressed firms can gain protection from their creditors while they restructure by filing for protection under U.S. Bankruptcy Codes. In a prepackaged bankruptcy, a firm negotiates a reorganization plan with its creditors prior to filing for bankruptcy. This can result in a much quicker exit from bankruptcy than tradional bankruptcy filings. A study of 49 prepackaged bankruptcies was published in Financial Management (Spring, 1995). For each firm, information was collected on the time (in months) in bankruptcy as well as the results of the board of directors’ vote on the type of reorganization plan. Three types of plans were studied: “Joint”—a joint exachange offer with prepackaged bankruptcy solicitation; “Prepack”—prepackaged bankruptcy solicitation only; and “None”—no pre-filing vote held. The data for the 49 firms is provided in the accompanying table. a. Construct a stem-and-leaf display for the length of time in bankruptcy for all 49 companies. b. Summarize the information reflected in the stem-and-leaf display from part a. Make a general statement about the length of time in bankruptcy for firms using “prepacks.” c. Select a graphical method that will permit a comparison of the time-in-bankruptcy distributions for the three types or reorganization plans. d. Firms that were reorganized through a leveraged buyout are identified by an asterisk in the table. Mark these firms on the stem-and-leaf display, part a, by circling their bankruptcy times. Do you observe any pattern in the graph? Explain.
Read more -
Chapter 2: Problem 54 Statistics for Business and Economics 12
Active nuclear power plants. The U.S. Energy Information Administration monitors all nuclear power plants operating in the United States. The table below lists the number of active nuclear power plants operating in each of a sample of 20 states. All of the data are saved in the NUCLEAR file. a. Find the mean, median, and mode of this data set. b. Eliminate the largest value from the data set and repeat part a. What effect does dropping this measurement have on the measures of central tendency found in part a? c. Arrange the 20 values in the table from lowest to highest. Next, eliminate the lowest two values and the highest two values from the data set, and find the mean of the remaining data values. The result is called a 10% trimmed mean, since it is calculated after removing the highest 10% and the lowest 10% of the data values. What advantages does a trimmed mean have over the regular arithmetic mean?
Read more -
Chapter 2: Problem 55 Statistics for Business and Economics 12
Problem 55E Professional athletes’ salaries. The salaries of superstar professional athletes receive much attention in the media. The multimillion-dollar long-term contract is now commonplace among this elite group. Nevertheless, rarely does a season pass without negotiations between one or more of the players’ associations and team owners for additional salary and fringe benefits for all players in their particular sports. a. If a players’ association wanted to support its argument for higher “average” salaries, which measure of central tendency do you think it should use? Why? b. To refute the argument, which measure of central tendency should the owners apply to the players’ salaries? Why?
Read more -
Chapter 2: Problem 57 Statistics for Business and Economics 12
Problem 57E Calculate the range, variance, and standard deviation for the following samples: a. 4, 2, 1, 0, 1 b. 1, 6, 2, 2, 3, 0, 3 c. 8, -2, 1, 3, 5, 4, 4, 1, 3, 3 d. 0, 2, 0, 0, -1, 1, -2, 1, 0, -1, 1, -1, 0, -3,-2, -1, 0, 1
Read more -
Chapter 2: Problem 58 Statistics for Business and Economics 12
Problem 58E Calculate the variance and standard deviation for samples where a. n = 10, ?x2 = 84, ?x = 20 b. n = 40, ?x2 = 380, ?x = 100 c. n = 20, ?x2 = 18, ?x = 17
Read more -
Chapter 2: Problem 56 Statistics for Business and Economics 12
Answer the following questions about variability of data sets: a. What is the primary disadvantage of using the range to compare the variability of data sets? b. Describe the sample variance using words rather than a formula. Do the same with the population variance. c. Can the variance of a data set ever be negative? Explain. Can the variance ever be smaller than the standard deviation? Explain.
Read more -
Chapter 2: Problem 59 Statistics for Business and Economics 12
Problem 59E Compute , s2, and s for each of the following data sets. If appropriate, specify the units in which your answer is expressed. a. 3, 1, 10, 10, 4 b. 8 feet, 10 feet, 32 feet, 5 feet c. -1, -4, -3, 1, -4, -4 d. 1/5 ounce, 1/5 ounce, 1/5 ounce, 2/5 ounce, 1/5 ounce, 4/5 ounce
Read more -
Chapter 2: Problem 60 Statistics for Business and Economics 12
Calculate the range, variance, and standard deviation for the following samples: a. 39, 42, 40, 37, 41 b. 100, 4, 7, 96, 80, 3, 1, 10, 2 c. 100, 4, 7, 30, 80, 30, 42, 2
Read more -
Chapter 2: Problem 61 Statistics for Business and Economics 12
Using only integers between 0 and 10, construct two data sets with at least 10 observations each that have the same range but different means. Construct a dot plot for each of your data sets, and mark the mean of each data set on its dot diagram.
Read more -
Chapter 2: Problem 62 Statistics for Business and Economics 12
Using only integers between 0 and 10, construct two data sets with at least 10 observations each so that the two sets have the same mean but different variances. Construct dot plots for each of your data sets and mark the mean of each data set on its dot diagram.
Read more -
Chapter 2: Problem 63 Statistics for Business and Economics 12
Consider the following sample of five measurements: 2, 1, 1, 0, 3. a. Calculate the range, s2, and s. b. Add 3 to each measurement and repeat part a. c. Subtract 4 from each measurement and repeat part a. d. Considering your answers to parts a, b, and c, what seems to be the effect on the variability of a data set by adding the same number to or subtracting the same number from each measurement?
Read more -
Chapter 2: Problem 64 Statistics for Business and Economics 12
Problem 64E Performance of stock screeners. Refer to the American Association of Individual Investors (AAII) statistics on stock screeners, Exercise 2.42 (p. 70). Annualized percentage return on investment (as compared to the Standard & Poor’s 500 Index) for 13 randomly selected stock screeners are reproduced in the table. a. Find the range of the data for the 13 stock screeners. Give the units of measurement for the range. b. Find the variance of the data for the 13 stock screeners. If possible, give the units of measurement for the variance. c. Find the standard deviation of the data for the 13 stock screeners. Give the units of measurement for the standard deviation. 2.42 Performance of stock screeners. Investment companies provide their clients with automated tools—called stock screeners—to help them select a portfolio of stocks to invest in. The American Association of Individual Investors (AAII) provides statistics on stock screeners at its Web site, www.aaii.com. The next table lists the annualized percentage return on investment (as compared to the Standard & Poor’s 500 Index) for 13 randomly selected stock screeners. (Note: A negative annualized return reflects a stock portfolio that performed worse than the S&P 500.) 9.0 -.1 -1.6 14.6 16.0 7.7 19.9 9.8 3.2 24.8 17.6 10.7 9.1 a. Compute the mean for the data set. Interpret its value. b. Compute the median for the data set. Interpret its value.
Read more -
Chapter 2: Problem 66 Statistics for Business and Economics 12
Is honey a cough remedy? Refer to the Archives of Pediatrics and Adolescent Medicine (Dec. 2007) study of honey as a remedy for coughing, Exercise 2.30 (p. 61). The coughing improvement scores (as determined by the children’s parents) for the patients in the over-the-counter cough medicine dosage (DM) group, honey dosage group, and control group are reproduced in the accompanying table. a. Find the standard deviation of the improvement scores for the honey dosage group. b. Find the standard deviation of the improvement scores for the DM dosage group. c. Find the standard deviation of the improvement scores for the control group. d. Based on the results, parts a–c, which group appears to have the most variability in coughing improvement scores? The least variability?
Read more -
Chapter 2: Problem 68 Statistics for Business and Economics 12
Doctors and ethics. Refer to the Journal of Medical Ethics (Vol. 32, 2006) study of physicians’ use of ethics consultation, Exercise 2.52 (p. 72). Again, consider an analysis of the quantitative variable, length of time in practice (i.e., years of experience). a. Access the data file and find the range, variance, and standard deviation for the length of time in practice (i.e., years of experience) variable. If possible, give a practical interpretation of each of these measures of variation. b. Consider only the physicians who would refuse to use ethics consultation in the future. Find the standard deviation for the length of time in practice for these physicians. c. Repeat part b for physicians who would use ethics consultation in the future. d. Use the results, parts b and c, to compare the variation in the length of time in practice distributions for physicians who would use and who would refuse ethics consultation in the future.
Read more -
Chapter 2: Problem 67 Statistics for Business and Economics 12
Problem 67E Corporate sustainability of CPA firms. Refer to the Business and Society (March 2011) study on the sustainability behaviors of CPA corporations, Exercise 2.46 (p. 71). Numerical measures of variation for level of support for the 992 senior managers are shown in the accompanying Minitab printout. a. Locate the range on the printout. Comment on the accuracy of the statement: “The difference between the largest and smallest values of level of support for the 992 senior managers is 155 points.” b. Locate the variance on the printout. Comment on the accuracy of the statement: “On average, the level of support for corporate sustainability for the 992 senior managers is 722 points.” c. Locate the standard deviation on the printout. Does the distribution of support levels for the 992 senior managers have more or less variation than another distribution with a standard deviation of 50? Explain. d. Which measure of variation best describes the distribution of 992 support levels? Explain. 2.46 Corporate sustainability of CPA firms. Refer to the Business and Society (March 2011) study on the sustainability behaviors of CPA corporations, Exercise 2.23 (p. 59). Recall that the level of support for corporate sustainability (measured on a quantitative scale ranging from 0 to 160 points) was obtained for each 992 senior managers at CPA firms. Numerical measures of central tendency for level of support are shown in the accompanying Minitab printout. a. Locate the mean on the printout. Comment on the accuracy of the statement: “On average, the level of support for corporate sustainability for the 992 senior managers was 67.76 points.” b. Locate the median on the printout. Comment on the accuracy of the statement: “Half of the 992 senior managers reported a level of support for corporate sustainability below 68 points.” c. Locate the mode on the printout. Comment on the accuracy of the statement: “Most of the 992 senior managers reported a level of support for corporate sustainability below 64 points.” d. Based on the values of the measures of central tendency, make a statement about the type of skewness (if any) that exists in the distribution of 992 support levels. Check your answer by examining the histogram shown in Exercise 2.23. 2.23 Corporate sustainability of CPA firms. Refer to the Business and Society (March 2011) study on the sustainability behaviors of CPA corporations, Exercise 1.26 (p. 27). Corporate sustainability, recall, refers to business practices designed around social and environmental considerations. Data on the level of support for corporate sustainability were obtained for 992 senior managers. Level of support was measured quantitatively. Simulation was used to convert the data from the study to a scale ranging from 0 to 160 points, where higher point values indicate a higher level of support for sustainability. a. A histogram for level of support for sustainability is shown next. What type of histogram is produced, frequency or relative frequency? b. Use the graph to estimate the percentage of the 992 senior managers who reported a high (100 points or greater) level of support for corporate sustainability. 1.26 Corporate sustainability and firm characteristics. Corporate sustainability refers to business practices designed around social and environmental considerations (e.g., “going green”). Business and Society (March 2011) published a paper on how firm size and firm type impact sustainability behaviors. The researchers added questions on sustainability to a quarterly survey of Certified Public Accountants (CPAs). The survey was sent to approximately 23,500 senior managers at CPA firms, of which 1,293 senior managers responded. (Note: It is not clear how the 23,500 senior managers were selected.) Due to missing data (incomplete survey answers), only 992 surveys were analyzed. These data were used to infer whether larger firms are more likely to report sustainability policies than smaller firms and whether public firms are more likely to report sustainability policies than private firms. a. Identify the population of interest to the researchers. b. What method was used to collect the sample data? c. Comment on the representativeness of the sample. d. How will your answer to part c impact the validity of the inferences drawn from the study?
Read more -
Chapter 2: Problem 69 Statistics for Business and Economics 12
Active nuclear power plants. Refer to Exercise and the U.S. Energy Information Administration’s data on the number of nuclear power plants operating in each of 20 states. The data are saved in the NUCLEAR file. a. Find the range, variance, and standard deviation of this data set. b. Eliminate the largest value from the data set and repeat part a. What effect does dropping this measurement have on the measures of variation found in part a? c. Eliminate the smallest and largest value from the data set and repeat part a. What effect does dropping both of these measurements have on the measures of variation found in part a?
Read more -
Chapter 2: Problem 49 Statistics for Business and Economics 12
Problem 49E Symmetric or skewed? Would you expect the data sets described below to possess relative frequency distributions that are symmetric, skewed to the right, or skewed to the left? Explain. a. The salaries of all persons employed by a large university b. The grades on an easy test c. The grades on a difficult test d. The amounts of time students in your class studied last week e. The ages of automobiles on a used-car lot f. The amounts of time spent by students on a difficult examination (maximum time is 50 minutes)
Read more -
Chapter 2: Problem 71 Statistics for Business and Economics 12
Problem 71E The output from a statistical software package indicates that the mean and standard deviation of a data set consisting of 200 measurements are $1,500 and $300, respectively. a. What are the units of measurement of the variable of interest? Based on the units, what type of data is this: quantitative or qualitative? b. What can be said about the number of measurements between $900 and $2,100? Between $600 and $2,400? Between $1,200 and $1,800? Between $1,500 and $2,100?
Read more -
Chapter 2: Problem 65 Statistics for Business and Economics 12
Problem 65E U.S. wine export markets. Refer to the data on the top 30 U.S. export markets for sparkling wines, compiled by the Center for International Trade Development (CITD), given in Exercise 2.43 (p. 70). The Minitab descriptive statistics printout for the amount exported (thousands of dollars) and 3-year percentage change for the 30 countries is reproduced below. a. Use the information on the printout to find the range of the amount exported. b. Locate the standard deviation of the amount exported on the printout. c. Use the result, part b, to find the variance of the amount exported. 2.43 U.S. wine export markets. The data in the next table, compiled by the Center for International Trade Development (CITD), provide a listing of the top 30 U.S. export markets for sparkling wines. Descriptive statistics for the amount exported (thousands of dollars) and 3-year percentage change for the 30 countries are shown in the Minitab printout below. a. Locate the mean amount exported on the printout and practically interpret its value. b. Locate the median amount exported on the printout and practically interpret its value. c. Locate the mean 3-year percentage change on the printout and practically interpret its value. d. Locate the median 3-year percentage change on the printout and practically interpret its value.
Read more -
Chapter 2: Problem 72 Statistics for Business and Economics 12
Problem 72E For any set of data, what can be said about the percentage of the measurements contained in each of the following intervals?
Read more -
Chapter 2: Problem 73 Statistics for Business and Economics 12
For a set of data with a mound-shaped relative frequency distribution, what can be said about the percentage of the measurements contained in each of the intervals specified in Exercise 2.72?
Read more -
Chapter 2: Problem 75 Statistics for Business and Economics 12
Given a data set with a largest value of 760 and a smallest value of 135, what would you estimate the standard deviation to be? Explain the logic behind the procedure you used to estimate the standard deviation. Suppose the standard deviation is reported to be 25. Is this feasible? Explain.
Read more -
Chapter 2: Problem 74 Statistics for Business and Economics 12
The following is a sample of 25 measurements: a. Compute \(\bar{x}, s^2\), and s for this sample. b. Count the number of measurements in the intervals \(\bar{x} \pm s, \bar{x} \pm 2 s, \bar{x} \pm 3 s\). Express each count as a percentage of the total number of measurements. c. Compare the percentages found in part b to the percentages given by the Empirical Rule and Chebyshev's Rule. d. Calculate the range and use it to obtain a rough approximation for s. Does the result compare favorably with the actual value for s found in part a?
Read more -
Chapter 2: Problem 70 Statistics for Business and Economics 12
Estimating production time. A widely used technique for estimating the length of time it takes workers to produce a product is the time study. In a time study, the task to be studied is divided into measurable parts, and each is timed with a stopwatch or filmed for later analysis. For each worker, this process is repeated many times for each subtask. Then the average and standard deviation of the time required to complete each subtask are computed for each worker. A worker’s overall time to complete the task under study is then determined by adding his or her subtask-time averages (Gaither and Frazier, Operations Management, 2001). The data (in minutes) given in the table are the result of a time study of a production operation involving two subtasks. a. Find the overall time it took each worker to complete the manufacturing operation under study. b. For each worker, find the standard deviation of the seven times for subtask 1. c. In the context of this problem, what are the standard deviations you computed in part b measuring? d. Repeat part b for subtask 2. e. If you could choose workers similar to A or workers similar to B to perform subtasks 1 and 2, which type would you assign to each subtask? Explain your decisions on the basis of your answers to parts a–d.
Read more -
Chapter 2: Problem 76 Statistics for Business and Economics 12
Problem 76E Do social robots walk or roll? Refer to the International Conference on Social Robotics (Vol. 6414, 2010) study on the current trend in the design of social robots, Exercise 2.3 (p. 48). Recall that in a random sample of social robots obtained through a Web search, 28 were built with wheels. The number of wheels on each of the 28 robots is listed in the accompanying table. a. Generate a histogram for the sample data set. Is the distribution of number of wheels mound-shaped and symmetric? b. Find the mean and standard deviation for the sample data set. c. Form the interval, . d. According to Chebychev’s rule, what proportion of sample observations will fall within the interval, part c? e. According to the Empirical Rule, what proportion of sample observations will fall within the interval, part c? f. Determine the actual proportion of sample observations that fall within the interval, part c. Even though the histogram, part a, is not perfectly symmetric, does the Empirical Rule provide a good estimate of the proportion? 2.3 Do social robots walk or roll? According to the United Nations, social robots now outnumber industrial robots worldwide. A social (or service) robot is designed to entertain, educate, and care for human users. In a paper published by the International Conference on Social Robotics (Vol. 6414, 2010), design engineers investigated the trend in the design of social robots. Using a random sample of 106 social robots obtained through a Web search, the engineers found that 63 were built with legs only, 20 with wheels only, 8 with both legs and wheels, and 15 with neither legs nor wheels. This information is portrayed in the accompanying graph. a. What type of graph is used to describe the data? b. Indentify the variable measured for each of the 106 robot designs. c. Use the graph to identify the social robot design that is currently used the most. d. Compute class relative frequencies for the different categories shown in the graph. e. Use the results from, part d to construct a Pareto diagram for the data.
Read more -
Chapter 2: Problem 78 Statistics for Business and Economics 12
Problem 78E Blogs for Fortune 500 firms. Refer to the Journal of Relationship Marketing (Vol. 7, 2008) study of the prevalence of blogs and forums at Fortune 500 firms with both English and Chinese Web sites, Exercise 2.9 (p. 49). In a sample of firms that provide blogs and forums as marketing tools, the mean number of blogs/forums per site was 4.25, with a standard deviation of 12.02. a. Provide an interval that is likely to contain the number of blogs/forums per site for at least 75% of the Fortune 500 firms in the sample. b. Do you expect the distribution of the number of blogs/ forums to be symmetric, skewed right, or skewed left? Explain. 2.9 Blogs for Fortune 500 firms. Web site communication through blogs and forums is becoming a key marketing tool for companies. The Journal of Relationship Marketing (Vol. 7, 2008) investigated the prevalence of blogs and forums at Fortune 500 firms with both English and Chinese web sites. Of the firms that provided blogs/forums as a marketing tool, the accompanying table gives a breakdown on the entity responsible for creating the blogs/forums. Use a graphical method to describe the data summarized in the table. Interpret the graph. Blog/Forum Percentage of Firms Created by company 38.5 Created by employees 34.6 Created by third party 11.5 Creator not identified 15.4 Source: Data from K. Mishra and C. Li, “Relationship marketing in FORTUNE 500 U.S. and Chinese web sites,” JOURNAL OF RELATIONSHIP MARKETING, Vol. 7, No. 1, 2008.
Read more -
Chapter 2: Problem 77 Statistics for Business and Economics 12
Problem 77E College dropout study. The American Economic Review (Dec. 2008) published a study on whether the removal of credit constraints would impact the likelihood of a student dropping out of college. As part of the investigation, the researchers looked for factors other than credit constraints that would influence the college dropout decision. One factor of interest was expected GPA for a college student who studied 3 hours per day. In a representative sample of 307 college students, the researchers reported the following summary statistics for the expected GPA of those who studied 3 hours per day: , s = .66. a. Give an interval that will contain most (at least 75% to approximately 95%) of the 307 GPAs. b. If you observe a GPA of 1.25, is it likely that this college student studied 3 hours per day? Explain.
Read more -
Chapter 2: Problem 79 Statistics for Business and Economics 12
Problem 79E Semester hours taken by CPA candidates. Refer to the Journal of Accounting and Public Policy (Spring 2002) study of 100,000 first-time candidates for the CPA exam, Exercise 2.51 (p. 72). Recall that the mean number of semester hours of college credit taken by the candidates was 141.31 hours. The standard-deviation was reported to be 17.77 hours. a. Compute the 2-standard-deviation interval around the mean. b. Make a statement about the proportion of first-time candidates for the CPA exam who have total college credit hours within the interval, part a. c. For the statement, part b, to be true, what must be known about the shape of the distribution of total semester hours? 2.51 Semester hours taken by CPA candidates. In order to become a certified public accountant (CPA), you must pass the Uniform CPA Exam. Many states require a minimum of 150 semester hours of college education before a candidate can sit for the CPA exam. However, traditionally, colleges only require 128 semester hours for an undergraduate degree. A study of whether the “extra” 22 hours of college credit is warranted for CPA candidates was published in the Journal of Accounting and Public Policy (Spring 2002). For one aspect of the study, researchers sampled over 100,000 first-time candidates for the CPA exam and recorded the total semester hours of college credit for each candidate. The mean and median for the data set were 141.31 and 140 hours, respectively. Interpret these values. Make a statement about the type of skewness, if any, that exists in the distribution of total semester hours.
Read more -
Chapter 2: Problem 80 Statistics for Business and Economics 12
Problem 80E Motivation of drug dealers. Researchers at Georgia State University investigated the personality characteristics of drug dealers in order to shed light on their motivation for participating in the illegal drug market (Applied Psychology in Criminal Justice, Sept. 2009). The sample consisted of 100 convicted drug dealers who attended a court-mandated counseling program. Each dealer was scored on the Wanting Recognition (WR) Scale, which provides a quantitative measure of a person’s level of need for approval and sensitivity to social situations. (Higher scores indicate a greater need for approval.) The sample of drug dealers had a mean WR score of 39, with a standard deviation of 6. Assume the distribution of WR scores for drug dealers is mound shaped and symmetric. a. Give a range of WR scores that will contain about 95% of the scores in the drug dealer sample. ________________ b. What proportion of the drug dealers will have WR scores above 51? ________________ c. Give a range of WR sores that will contain nearly all the scores in the drug dealer sample.
Read more -
Chapter 2: Problem 81 Statistics for Business and Economics 12
Problem 81E Sanitation inspection of cruise ships. Refer to Exercise and the Centers for Disease Control and Prevention listing of the sanitation scores for 186 cruise ships. The data are saved in the SHIPSANIT file. a. Find the mean and standard deviation of the sanitation scores. ________________ b. Calculate the intervals , , and . ________________ c. Find the percentage of measurements in the data set that fall within each of the intervals in part b . Do these percentages agree with either Chebyshev’s rule or the empirical rule? Sanitation inspection of cruise ships. To minimize the potential for gastrointestinal disease outbreaks, all passenger cruise ships arriving at U.S. ports are subject to unannounced sanitation inspections. Ships are rated on a 100-point scale by the Centers for Disease Control and Prevention. A score of 86 or higher indicates that the ship is providing an accepted standard of sanitation. The latest (as of Jan. 2010) sanitation scores for 186 cruise ships are saved in the SHIPSANIT file. The first five and last five observations in the data set are listed in the following table: Ship Name Sanitation Score Adventure of the Seas 98 AID Aaura 100 Albatross 69 Amadea 84 Amsterdam 99 ? ? Westerdam 99 Wind Spirit 97 Wind Surf 95 Zaandam 99 Zuiderdam 95 Based on National Center for Environmental Health, Centers for Disease Control and Prevention, Jan. 6, 2010. a. Generate a stem-and-leaf display of the data. Identify the stems and leaves of the graph. ________________ b. Use the stem-and-leaf display to estimate the proportion of ships that have an accepted sanitation standard. ________________ c. Locate the inspection score of 69 (Albatrass) on the stem-and-leaf display.
Read more -
Chapter 2: Problem 82 Statistics for Business and Economics 12
Laptop use in middle school. Many middle schools have initiated a program that provides every student with a free laptop (notebook) computer. Student usage of laptops at a middle school that participates in the initiative was investigated in American Secondary Education (Fall 2009). In a sample of 106 students, the researchers reported the following statistics on how many minutes per day each student used his or her laptop for taking notes: = 13.2, s = 19.5. a. Compute the interval, \(\bar{x} \pm 2 s\). b. Explain why the distribution of laptop usage for taking notes for these 106 students cannot be symmetric. c. Given your answer to part b, what percentage of the 106 students have laptop usages that fall within the \(\bar{x} \pm 2 s\) interval?
Read more -
Chapter 2: Problem 84 Statistics for Business and Economics 12
Time in bankruptcy. Refer to the Financial Management (Spring 1995) study of 49 firms filing for a prepackaged bankruptcy, Exercise 2.32 (p. 62). Data on the variable of interest, and length of time (months) in bankruptcy for each firm, are saved in the accompanying file. a. Construct a histogram for the 49 bankruptcy times. Comment on whether the Empirical Rule is applicable for describing the bankruptcy time distribution for firms filing for a prepackaged bankruptcy. b. Find numerical descriptive statistics for the data set. Use this information to construct an interval that captures at least 75% of the bankruptcy times. c. Count the number of the 49 bankruptcy times that fall within the interval, part b, and convert the result to a percentage. Does the result agree with Chebyshev’s Rule? The Empirical Rule? d. A firm is considering filing a prepackaged bankruptcy plan. Estimate the length of time the firm will be in bankruptcy.
Read more -
Chapter 2: Problem 86 Statistics for Business and Economics 12
Problem 86E Buy-side vs. sell-side analysts’ earnings forecasts. Financial analysts are hired by investment companies to make forecasts of stock prices and recommendations about whether to buy, sell, or hold specific securities. These analysts can be categorized as either “buy-side” analysts or “sell-side” analysts based on a variety of factors, including scope of industry coverage, sources of information used, and target audience. A group of Harvard Business School professors compared earnings forecasts of buy-side and sell-side analysts (Financial Analysts Journal, Jul/Aug 2008). Data were collected on 3,526 forecasts made by buy-side analysts and 58,562 forecasts made by sell-side analysts, and the relative absolute forecast error was determined for each. a. Frequency distributions for buy-side and sell-side analysts forecast errors (with the sell-side distribution superimposed over the buy-side distribution) are shown in the accompanying figure. Based on the figure, the researchers concluded “that absolute forecast errors for buy-side analysts have a higher mean and variance than those for the sell-side analysts.” Do you agree? Explain. b. The mean and standard deviation of forecast errors for both buy-side and sell-side analysts are given in the following table. For each type of analyst, provide an interval that will contain approximately 95% of the forecast errors. Compare these intervals. Which type of analyst is likely to have a relative forecast error of +2.00 or higher? Buy-Side Analysts Sell-Side Analysts Mean 0.85 -0.05 Standard deviation 1.93 0.85 Source: Based on Groysberg, B., Healy, P., & Chapman, C. Financial Analysis Journal, Vol. 64, No. 4. Jul/Aug. 2008 (Table 2).
Read more -
Chapter 2: Problem 85 Statistics for Business and Economics 12
Problem 85E Shopping vehicle and judgment. While shopping at the grocery store, are you more likely to buy a vice product (e.g., a candy bar) when pushing a shopping cart or when carrying a shopping basket? This was the question of interest in a study published in the Journal of Marketing Research (Dec. 2011). The researchers believe that when your arm is flexed (as when carrying a basket), you are more likely to choose a vice product than when your arm is extended (as when pushing a cart). To test this theory in a laboratory setting, the researchers recruited 22 consumers and asked each to push his or her hand against a table while being asked a serious of shopping questions. Half of the consumers were told to put their arms in a flex position (similar to a shopping basket) and the other half were told to put their arms in an extended position (similar to a shopping cart). Participants were offered several choices between a vice and a virtue (e.g., a movie ticket vs. a shopping coupon, paying later with a larger amount vs. paying now), and a choice score (on a scale of 0 to 100) was determined for each. (Higher scores indicate a greater preference for vice options.) The average choice score for consumers with a flexed arm was 59, while the average for consumers with an extended arm was 43. a. Suppose the standard deviations of the choice scores for the flexed arm and extended arm conditions are 4 and 2, respectively. Does this information support the researchers’ theory? Explain. b. Suppose the standard deviations of the choice scores for the flexed arm and extended arm conditions are 10 and 15, respectively. Does this information support the researchers’ theory? Explain.
Read more -
Chapter 2: Problem 89 Statistics for Business and Economics 12
Problem 89E Monitoring weights of flour bags. When it is working properly, a machine that fills 25-pound bags of flour dispenses an average of 25 pounds per fill; the standard deviation of the amount of fill is .1 pound. To monitor the performance of the machine, an inspector weighs the contents of a bag coming off the machine’s conveyor belt every half hour during the day. If the contents of two consecutive bags fall more than 2 standard deviations from the mean (using the mean and standard deviation given above), the filling process is said to be out of control, and the machine is shut down briefly for adjustments. The data given in the following table are the weights measured by the inspector yesterday. Assume the machine is never shut down for more than 15 minutes at a time. At what times yesterday was the process shut down for adjustment? Justify your answer. Time Weight(pounds) 8:00 a.m. 25.10 8:30 25.15 9:00 24.81 9:30 24.75 10:00 25.00 10:30 25.05 11:00 25.23 11:30 25.25 12:00 25.01 12:30 p.m. 25.06 1:00 24.95 1:30 24.80 2:00 24.95 2:30 25.21 3:00 24.90 3:30 24.71 4:00 25.31 4:30 25.15 5:00 25.20
Read more -
Chapter 2: Problem 88 Statistics for Business and Economics 12
Problem 88E Improving SAT scores. The National Education Longitudinal Survey (NELS) tracks a nationally representative sample of U.S. students from eighth grade through high school and college. Research published in Chance (Winter 2001) examined the SAT scores of 265 NELS students who paid a private tutor to help them improve their scores. The table summarizes the changes in both the SATMathematics and SAT-Verbal scores for these students. SAT–Math SAT–Verbal Mean change in score 19 7 Standard deviation of score changes 65 49 a. Suppose one of the 265 students who paid a private tutor is selected at random. Give an interval that is likely to contain this student’s change in the SAT–Math score. b. Repeat part a for the SAT–Verbal score. c. Suppose the selected student increased his score on one of the SAT tests by 140 points. Which test, the SAT– Math or SAT–Verbal, is the one most likely to have the 140-point increase? Explain.
Read more -
Chapter 2: Problem 91 Statistics for Business and Economics 12
Give the percentage of measurements in a data set that are above and below each of the following percentiles: a. 75th percentile b. 50th percentile c. 20th percentile d. 84th percentile
Read more -
Chapter 2: Problem 90 Statistics for Business and Economics 12
Problem 90E Compute the z-score corresponding to each of the following values of x: e. In parts a–d, state whether the z-score locates x within a sample or a population. f. In parts a–d, state whether each value of x lies above or below the mean and by how many standard deviations.
Read more -
Chapter 2: Problem 83 Statistics for Business and Economics 12
Bearing strength of concrete FRP strips. Fiber reinforced polymer (FRP) composite materials are the standard for strengthening, retrofitting, and repairing concrete structures. Typically, FRP strips are fastened to the concrete with epoxy adhesive. Engineers at the University of Wisconsin-Madison have developed a new method of fastening the FRP strips using mechanical anchors (Composites Fabrication Magazine, Sep. 2004). To evaluate the new fastening method, 10 specimens of pultruded FRP strips mechanically fastened to highway bridges were tested for bearing strength. The strength measurements (recorded in mega pascal units, Mpa) are shown in the table. Use the sample data to find an interval that is likely to contain the bearing strength of a pultruded FRP strip. 240.9 248.8 215.7 233.6 231.4 230.9 225.3 247.3 235.5 238.0 Source: Based on summary information provided in COMPOSITES FABRICATION MAGAZINE, September 2004, p. 32, Table 1.
Read more -
Chapter 2: Problem 87 Statistics for Business and Economics 12
Problem 87E Land purchase decision. A buyer for a lumber company must decide whether to buy a piece of land containing 5,000 pine trees. If 1,000 of the trees are at least 40 feet tall, the buyer will purchase the land; otherwise, he won’t. The owner of the land reports that the height of the trees has a mean of 30 feet and a standard deviation of 3 feet. Based on this information, what is the buyer’s decision?
Read more -
Chapter 2: Problem 94 Statistics for Business and Economics 12
Problem 94E Suppose that 40 and 90 are two elements of a population data set and that their z-scores are -2 and 3, respectively. Using only this information, is it possible to determine the population’s mean and standard deviation? If so, find them. If not, explain why it’s not possible.
Read more -
Chapter 2: Problem 93 Statistics for Business and Economics 12
Compare the z-scores to decide which of the following x values lie the greatest distance above the mean and the greatest distance below the mean. a. \(x=100, \mu=50, \sigma=25\) b. \(x=1, \mu=4, \sigma=1\) c. \(x=0, \mu=200, \sigma=100\) d. \(x=10, \mu=5, \sigma=3\)
Read more -
Chapter 2: Problem 95 Statistics for Business and Economics 12
Mathematics assessment test scores. According to the National Center for Education Statistics (2009), scores on a mathematics assessment test for United States eighth graders have a mean of 283, a 25th percentile of 259, a 75th percentile of 308, and a 90th percentile of 329. Interpret each of these numerical descriptive measures.
Read more -
Chapter 2: Problem 96 Statistics for Business and Economics 12
Problem 96E Motivation of drug dealers. Refer to the Applied Psychology in Criminal Justice (Sep. 2009) study of convicted drug dealers’ motivations, Exercise 2.80 (p. 85). Recall that the sample of drug dealers had a mean Wanting Recognition (WR) score of 39 points, with a standard deviation of 6 points. a. Find and interpret the z-score for a drug dealer with a WR score of 30 points. b. What proportion of the sampled drug dealers had WR scores below 39 points? (Assume the distribution of WR scores is mound-shaped and symmetric.) c. If 5% of convicted drug dealers have WR scores above 49 points, give a percentile ranking for the WR score of 49. 2.80 Motivation of drug dealers. Researchers at Georgia State University investigated the personality characteristics of drug dealers in order to shed light on their motivation for participating in the illegal drug market (Applied Psychology in Criminal Justice, Sep. 2009). The sample consisted of 100 convicted drug dealers who attended a court-mandated counseling program. Each dealer was scored on the Wanting Recognition (WR) Scale, which provides a quantitative measure of a person’s level of need for approval and sensitivity to social situations. (Higher scores indicate a greater need for approval.) The sample of drug dealers had a mean WR score of 39, with a standard deviation of 6. Assume the distribution of WR scores for drug dealers is mound-shaped and symmetric. a. Give a range of WR scores that will contain about 95% of the scores in the drug dealer sample. b. What proportion of the drug dealers had WR scores above 51? c. Give a range of WR sores that contain nearly all the scores in the drug dealer sample.
Read more -
Chapter 2: Problem 92 Statistics for Business and Economics 12
Problem 92E In terms of percentiles, define QL, QM, and QU.
Read more -
Chapter 2: Problem 97 Statistics for Business and Economics 12
Problem 97E Starting and mid-career salaries of bachelor’s degree graduates. PayScale, Inc., an online provider of global compensation data, recently conducted a survey of 1.2 million bachelor’s degree graduates with a minimum of 10 years of work experience. Three of the many variables measured by PayScale were the graduate’s starting salary, mid-career salary, and the college or university where they obtained their degree. A summary of the starting and mid-career salary data was reported in the Wall Street Journal (July 31, 2008). Descriptive statistics were provided for each of the over 300 colleges and universities that graduates attended. For example, graduates of the University of South Florida (USF) had a median starting salary of $41,100, a median mid-career salary of $71,100, and a mid-career 90th percentile salary of $131,000. Describe the salary distribution of USF bachelor’s degree graduates by interpreting each of these summary statistics.
Read more -
Chapter 2: Problem 99 Statistics for Business and Economics 12
Problem 99E Lead in drinking water. The U.S. Environmental Protection Agency (EPA) sets a limit on the amount of lead permitted in drinking water. The EPA Action Level for lead is .015 milligrams per liter (mg/L) of water. Under EPA guidelines, if 90% of a water system’s study samples have a lead concentration less than .015 mg/L, the water is considered safe for drinking. I (coauthor Sincich) received a recent report on a study of lead levels in the drinking water of homes in my subdivision. The 90th percentile of the study sample had a lead concentration of .00372 mg/L. Are water customers in my subdivision at risk of drinking water with unhealthy lead levels? Explain.
Read more -
Chapter 2: Problem 100 Statistics for Business and Economics 12
Corporate sustainability of CPA firms. Refer to the Business and Society (March 2011) study on the sustainability behaviors of CPA corporations, Exercise 2.67 (p. 78). Numerical descriptive measures for level of support for corporate sustainability for the 992 senior managers are repeated in the accompanying Minitab printout. One of the managers reported a support level of 155 points. Would you consider this support level to be typical of the study sample? Explain.
Read more -
Chapter 2: Problem 101 Statistics for Business and Economics 12
Hazardous waste cleanup in Arkansas. The Superfund Act was passed by Congress to encourage state participation in the implementation of a law relating to the release and cleanup of hazardous substances. Hazardous waste sites financed by the Superfund Act are called Superfund sites. A total of 393 Superfund sites are operated by waste management companies in Arkansas (Tabor and Stanwick, Arkansas Business and Economic Review, Summer 1995). The numbers of these Superfund sites in each of Arkansas’s 75 counties are shown in the next table. a. Find the 10th percentile of the data set. Interpret the result. b. Find the 95th percentile of the data set. Interpret the result. c. Find the mean and standard deviation of the data; then use these values to calculate the z-score for an Arkansas county with 48 Superfund sites. d. Based on your answer to part c, would you classify 48 as an extreme number of Superfund sites?
Read more -
Chapter 2: Problem 98 Statistics for Business and Economics 12
Sanitation inspection of cruise ships. Refer to the sanitation levels of cruise ships presented in Exercise and saved in the SHIPSANIT file. a. Give a measure of relative standing for the Nautilus Explorer’s score of 74. Interpret the result. b. Give a measure of relative standing for Rotterdam's score of 92. Interpret the result.
Read more -
Chapter 2: Problem 103 Statistics for Business and Economics 12
Problem 103E Ranking PhD programs in economics. Thousands of students apply for admission to graduate schools in economics each year with the intention of obtaining a PhD. The Southern Economic Journal (Apr. 2008) published a guide to graduate study in economics by ranking the PhD programs at 129 colleges and universities. Each program was evaluated according to the number of publications published by faculty teaching in the PhD program and by the quality of the publications. Data obtained from the Social Science Citation Index (SSCI) were used to calculate an overall productivity score for each PhD program. The mean and standard deviation of these 129 productivity scores were then used to compute a z-score for each economics program. Harvard University had the highest z-score (z = 5.08) and, hence, was the top-ranked school; Howard University was ranked last because it had the lowest z-score (z = -0.81). The data (z-scores) for all 129 economic programs are saved in the data file. a. Interpret the z-score for Harvard University. b. Interpret the z-score for Howard University. c. The authors of the Southern Economic Journal article note that “only 44 of the 129 schools have positive z-scores, indicating that the distribution of overall productivity is skewed to the right.” Do you agree? (Check your answer by constructing a histogram for the z-scores in the file.)
Read more -
Chapter 2: Problem 102 Statistics for Business and Economics 12
Problem 102E Blue- vs. red-colored exam study. In a study of how external clues influence performance, professors at the University of Alberta and Pennsylvania State University gave two different forms of a midterm examination to a large group of introductory students. The questions on the exam were identical and in the same order, but one exam was printed on blue paper and the other on red paper (Teaching Psychology, May 1998). Grading only the difficult questions on the exam, the researchers found that scores on the blue exam had a distribution with a mean of 53% and a standard deviation of 15%, while scores on the red exam had a distribution with a mean of 39% and a standard deviation of 12%. (Assume that both distributions are approximately mound-shaped and symmetric.) a. Give an interpretation of the standard deviation for the students who took the blue exam. b. Give an interpretation of the standard deviation for the students who took the red exam. c. Suppose a student is selected at random from the group of students who participated in the study and the student’s score on the difficult questions is 20%. Which exam form is the student more likely to have taken, the blue or the red exam? Explain.
Read more -
Chapter 2: Problem 105 Statistics for Business and Economics 12
Problem 105E Ranking PhD programs in economics (cont’d). Refer to the Southern Economic Journal (Apr. 2008) study of PhD programs in economics, Exercise 2.103. The authors also made the following observation: “A noticeable feature of this skewness is that distinction between schools diminishes as the rank declines. For example, the top-ranked school, Harvard, has a z-score of 5.08, and the fifth-ranked school, Yale, has a z-score of 2.18, a substantial difference. However, . . . , the 70th-ranked school, the University of Massachusetts, has a z-score of –0.43, and the 80th-ranked school, the University of Delaware, has a z-score of –0.50, a very small difference. [Consequently] the ordinal rankings presented in much of the literature that ranks economics departments miss the fact that below a relatively small group of top programs, the differences in [overall] productivity become fairly small.” Do you agree? 2.103 Ranking PhD programs in economics. Thousands of students apply for admission to graduate schools in economics each year with the intention of obtaining a PhD. The Southern Economic Journal (Apr. 2008) published a guide to graduate study in economics by ranking the PhD programs at 129 colleges and universities. Each program was evaluated according to the number of publications published by faculty teaching in the PhD program and by the quality of the publications. Data obtained from the Social Science Citation Index (SSCI) were used to calculate an overall productivity score for each PhD program. The mean and standard deviation of these 129 productivity scores were then used to compute a z-score for each economics program. Harvard University had the highest z-score (z = 5.08) and, hence, was the top-ranked school; Howard University was ranked last because it had the lowest z-score (z = -0.81). The data (z-scores) for all 129 economic programs are saved in the data file. a. Interpret the z-score for Harvard University. b. Interpret the z-score for Howard University. c. The authors of the Southern Economic Journal article note that “only 44 of the 129 schools have positive z-scores, indicating that the distribution of overall productivity is skewed to the right.” Do you agree? (Check your answer by constructing a histogram for the z-scores in the file.)
Read more -
Chapter 2: Problem 107 Statistics for Business and Economics 12
Suppose a data set consisting of exam scores has a lower quartile QL = 60, a median QM = 75, and an upper quartile QU = 85. The scores on the exam range from 18 to 100. Without having the actual scores available to you, construct as much of the box plot as possible.
Read more -
Chapter 2: Problem 106 Statistics for Business and Economics 12
Problem 106E A sample data set has a mean of 57 and a standard deviation of 11. Determine whether each of the following sample measurements are outliers. a. 65 b. 21 c. 72 d. 98
Read more -
Chapter 2: Problem 108 Statistics for Business and Economics 12
Problem 108E Consider the horizontal box plot shown below. a. What is the median of the data set (approximately)? b. What are the upper and lower quartiles of the data set (approximately)? c. What is the interquartile range of the data set (approximately)? d. Is the data set skewed to the left, skewed to the right, or symmetric? e. What percentage of the measurements in the data set lie to the right of the median? To the left of the upper quartile? f. Identify any outliers in the data.
Read more -
Chapter 2: Problem 110 Statistics for Business and Economics 12
Problem 110E Treating psoriasis with the “Doctorfish of Kangal.” Psoriasis is a skin disorder with no known cure and no proven effective pharmacological treatment. An alternative treatment for psoriasis is ichthyotherapy, also known as therapy with the “Doctorfish of Kangal.” Fish from the hot pools of Kangal, Turkey, feed on the skin scales of bathers, reportedly reducing the symptoms of psoriasis. In one study, 67 patients diagnosed with psoriasis underwent 3 weeks of ichthyotherapy (Evidence-Based Research in Complementary and Alternative Medicine, Dec. 2006). The Psoriasis Area Severity Index (PASI) of each patient was measured both before and after treatment. (The lower the PASI score, the better is the skin condition.) Box plots of the PASI scores, both before (baseline) and after 3 weeks of ichthyotherapy treatment, are shown in the accompanying diagram. Source: Based on “Ichthyotherapy as alternative treatment for patients with psoriasis: A pilot study” by M. Grassberger and W. Hoch, from EVIDENCE-BASED RESEARCH IN COMPLEMENTARY AND ALTERNATIVE MEDICINE, December 2006, Volume 3(4). a. Find the approximate 25th percentile, the median, and the 75th percentile for the PASI scores before treatment. b. Find the approximate 25th percentile, the median, and the 75th percentile for the PASI scores after treatment. c. Comment on the effectiveness of ichthyotherapy in treating psoriasis.
Read more -
Chapter 2: Problem 109 Statistics for Business and Economics 12
Consider the following two sample data sets, saved in the LM2_132 file: a. Construct a box plot for each data set. b. Identify any outliers that may exist in the two data sets.
Read more -
Chapter 2: Problem 111 Statistics for Business and Economics 12
Problem 111E Budget lapsing at army hospitals. Accountants use the term budget lapsing to describe the situation that occurs when unspent funds do not carry over from one budgeting period to the next. Due to budget lapsing, U.S. army hospitals tend to stockpile pharmaceuticals and other supplies toward the end of the fiscal year, leading to a spike in expenditures. This phenomenon was investigated in the Journal of Management Accounting Research (Vol. 19, 2007). Data on expenses per full-time equivalent employees for a sample of 1,751 army hospitals yielded the following summary statistics: x? = $6,563, m = $6,232, s =$2,484, QL = $5,309, and QU = $7,216. a. Interpret, practically, the measures of relative standing. b. Compute the interquartile range, IQR, for the data. c. What proportion of the 1,751 army hospitals have expenses between $5,309 and $7,216?
Read more -
Chapter 2: Problem 104 Statistics for Business and Economics 12
Using z -scores for grades. At one university, the students are given z-scores at the end of each semester rather than the traditional GPAs. The mean and standard deviation of all students’ cumulative GPAs, on which the z-scores are based, are 2.7 and .5, respectively. a. Translate each of the following z-scores to the corresponding GPA: z = 2.0, z = -1.0, z = .5, z = -2.5. b. Students with z-scores below -1.6 are put on probation. What is the corresponding probationary GPA? c. The president of the university wishes to graduate the top 16% of the students with cum laude honors and the top 2.5% with summa cum laude honors. Where (approximately) should the limits be set in terms of z-scores? In terms of GPAs? What assumption, if any, did you make about the distribution of the GPAs at the university?
Read more -
Chapter 2: Problem 112 Statistics for Business and Economics 12
Problem 112E Salary offers to MBAs. Consider the top salary offer (in thousands of dollars) received by each member of a sample of 50 MBA students who graduated from the Graduate School of Management at Rutgers, the state university of New Jersey. Descriptive statistics and a box plot for the data are shown on the XLSTAT printouts below. a. Find and interpret the z-score associated with the highest salary offer, the lowest salary offer, and the mean salary offer. Would you consider the highest offer to be unusually high? Why or why not? b. Based on the box plot for this data set, which salary offers (if any) are suspect or highly suspect outliers?
Read more -
Chapter 2: Problem 113 Statistics for Business and Economics 12
Problem 113E Semester hours taken by CPA candidates. Refer to the Journal of Accounting and Public Policy (Spring 2002) study of 100,000 first-time candidates for the CPA exam, Exercise 2.51 (p. 72). The number of semester hours of college credit earned by the candidates had a mean of 141.31 hours and a standard deviation of 17.77 hours. a. Find the z-score for a first-time candidate for the CPA exam who earned 160 semester hours of college credit. Is this observation considered an outlier? b. Give a value of the number of semester hours that would, in fact, be considered an outlier in this data set. 2.51 Semester hours taken by CPA candidates. In order to become a certified public accountant (CPA), you must pass the Uniform CPA Exam. Many states require a minimum of 150 semester hours of college education before a candidate can sit for the CPA exam. However, traditionally, colleges only require 128 semester hours for an undergraduate degree. A study of whether the “extra” 22 hours of college credit is warranted for CPA candidates was published in the Journal of Accounting and Public Policy (Spring 2002). For one aspect of the study, researchers sampled over 100,000 first-time candidates for the CPA exam and recorded the total semester hours of college credit for each candidate. The mean and median for the data set were 141.31 and 140 hours, respectively. Interpret these values. Make a statement about the type of skewness, if any, that exists in the distribution of total semester hours.
Read more -
Chapter 2: Problem 114 Statistics for Business and Economics 12
Corporate sustainability of CPA firms. Refer to the Business and Society (March 2011) study on the sustainability behaviors of CPA corporations, Exercise 2.100 (p. 91). Recall that data on the level of support for corporate sustainability were recorded for each of 992 senior managers. One of the managers reported a support level of 155 points. Use both a graph and a numerical technique to determine if this observation is an outlier.
Read more -
Chapter 2: Problem 116 Statistics for Business and Economics 12
Hazardous waste cleanup in Arkansas. Refer to Exercise 2.101 (p. 90) and the data on the number of Superfund sites in each of 75 Arkansas counties. a. There is at least one outlier in the data. Use the methods of this chapter to detect the outliers. b. Delete the outlier(s) found in part a from the data set and recalculate measures of central tendency and variation. Which measures are most affected by the removal of the outlier(s)?
Read more -
Chapter 2: Problem 118 Statistics for Business and Economics 12
Network server downtime. A manufacturer of network computer server systems is interested in improving its customer support services. As a first step, its marketing department has been charged with the responsibility of summarizing the extent of customer problems in terms of system downtime. The 40 most recent customers were surveyed to determine the amount of downtime (in hours) they had experienced during the previous month. These data are listed in the table. a. Construct a box plot for these data. Use the information reflected in the box plot to describe the frequency distribution of the data set. Your description should address central tendency, variation, and skewness. b. Use your box plot to determine which customers are having unusually lengthy downtimes. c. Find and interpret the z-scores associated with the customers you identified in part b.
Read more -
Chapter 2: Problem 117 Statistics for Business and Economics 12
Sanitation inspection of cruise ships. Refer to the data on sanitation levels of cruise ships, presented in Exercise. These data are saved in the SHIPSANIT file. a. Use the box plot method to detect any outliers in the data. b. Use the z -score method to detect any outliers in the data. c. Do the two methods agree? If not, explain why.
Read more -
Chapter 2: Problem 115 Statistics for Business and Economics 12
Problem 115E Time in bankruptcy. Refer to the Financial Management (Spring 1995) study of 49 firms filing for prepackaged bankruptcies, Exercise 2.32 (p. 62). Recall that three types of “prepack” firms exist: (1) those who hold no prefiling vote, (2) those who vote their preference for a joint solution; and (3) those who vote their preference for a prepack. a. Construct a box plot for the time in bankruptcy (months) for each type of firm. b. Find the median bankruptcy times for the three types. c. How do the variabilities of the bankruptcy times compare for the three types? d. The standard deviations of the bankruptcy times are 2.47 for “none,” 1.72 for “joint,” and 0.96 for “prepack.” Do the standard deviations agree with the interquartile ranges with regard to the comparison of the variabilities of the bankruptcy times? e. Is there evidence of outliers in any of the three distributions?
Read more -
Chapter 2: Problem 120 Statistics for Business and Economics 12
Sensor motion of a robot. Researchers at Carnegie Mellon University developed an algorithm for estimating the sensor motion of a robotic arm by mounting a camera with inertia sensors on the arm (International Journal of Robotics Research, Dec. 2004). One variable of interest is the error of estimating arm translation (measured in centimeters). Data for 10 experiments are listed in the following table. In each experiment, the perturbation of camera intrinsics and projections were varied. Suppose a trial resulted in a translation error of 4.5 cm. Is this value an outlier for trials with perturbed intrinsics but no perturbed projections? For trials with perturbed projections but no perturbed intrinsics? What type of camera perturbation most likely occurred for this trial?
Read more -
Chapter 2: Problem 119 Statistics for Business and Economics 12
Problem 119E Made-to-order delivery times. Refer to the data on delivery times for a made-to-order product, Exercise 2.34 (p. 63). The delivery times (in days) for a sample of 25 orders are repeated in the accompanying table. (Times marked by an asterisk are associated with customers who subsequently placed additional orders with the company.) Identify any unusual observations (outliers) in the data set, and then use the results to comment on the claim that repeat customers tend to have shorter delivery times than one-time customers.
Read more -
Chapter 2: Problem 121 Statistics for Business and Economics 12
Construct a scatterplot for the data in the following table.
Read more -
Chapter 2: Problem 122 Statistics for Business and Economics 12
Construct a scatterplot for the data in the following table.
Read more -
Chapter 2: Problem 123 Statistics for Business and Economics 12
Problem 123E In business, do nice guys really finish last? In baseball, there is an old saying that “nice guys finish last.” Is this true in the competitive corporate world? Researchers at Harvard University attempted to answer this question and reported their results in Nature (March 20, 2008). In the study, Boston-area college students repeatedly played a version of the game “prisoner’s dilemma,” where competitors choose cooperation, defection, or costly punishment. (Cooperation meant paying 1 unit for the opponent to receive 2 units; defection meant gaining 1 unit at a cost of 1 unit for the opponent; and punishment meant paying 1 unit for the opponent to lose 4 units.) At the conclusion of the games, the researchers recorded the average payoff and the number of times punishment was used against each player. A graph of the data is shown in the accompanying scatterplot. Does it appear that average payoff is associated with punishment use? The researchers concluded that “winners don’t punish.” Do you agree? Explain.
Read more -
Chapter 2: Problem 124 Statistics for Business and Economics 12
Problem 124E Lobster trap placement. Strategic placement of lobster traps is one of the keys for a successful lobster fisherman. An observational study of teams fishing for the red spiny lobster in Baja California Sur, Mexico, was conducted and the results published in Bulletin of Marine Science (April 2010). Two variables measured for each of eight teams from the Punta Abreojos (PA) fishing cooperative were y = total catch of lobsters (in kilograms) during the season and x = average percentage of traps allocated per day to exploring areas of unknown catch (called search frequency). These data are listed in the accompanying table. Graph the data in a scatterplot. What type of trend, if any, do you observe? Lobster Fishing Study Data Total Catch Search Frequency 2,785 35 6,535 21 6,695 26 4,891 29 4,937 23 5,727 17 7,019 21 5,735 20 Source: Based on Shester, G. G. “Explaining catch variation among Baja California lobster fishers through spatial analysis of trap-placement decisions,” Bulletin of Marine Science, Vol. 86, No. 2, April 2010 (Table 1), pp. 479–498.
Read more -
Chapter 2: Problem 126 Statistics for Business and Economics 12
State SAT scores. Refer to Exercise 2.27 (p. 60) and the data on state SAT scores. Construct a scatterplot for the data, with 2001 Math SAT score on the horizontal axis and 2011 Math SAT score on the vertical axis. What type of trend do you detect?
Read more -
Chapter 2: Problem 127 Statistics for Business and Economics 12
Are geography journals worth their cost? In Geoforum (Vol. 37, 2006), Simon Fraser University professor Nicholas Blomley assessed whether the price of a geography journal is correlated with quality. He collected pricing data (cost for a 1-year subscription in U.S. dollars) for a sample of 28 geography journals. In addition to cost, three other variables were measured: Journal Impact Factor (JIF), defined as the average number of times articles from the journal have been cited; number of citations for a journal over the past 5 years; and Relative Price Index (RPI), a measure developed by economists. [Note: A journal with an RPI less than 1.25 is considered a “good value.”] The data for the 28 geography journals are listed in the accompanying table. a. Construct a scatterplot for the variables JIF and cost. Do you detect a trend? b. Construct a scatterplot for the variables number of cites and cost. Do you detect a trend? c. Construct a scatterplot for the variables RPI and cost. Do you detect a trend?
Read more -
Chapter 2: Problem 128 Statistics for Business and Economics 12
Problem 128E Spreading rate of spilled liquid. A contract engineer at DuPont Corp. studied the rate at which a spilled volatile liquid will spread across a surface (Chemical Engineering Progress, Jan. 2005). Assume 50 gallons of methanol spills onto a level surface outdoors. The engineer used derived empirical formulas (assuming a state of turbulent-free convection) to calculate the mass (in pounds) of the spill after a period of time ranging from 0 to 60 minutes. The calculated mass values are given in the table. Is there evidence to indicate that the mass of the spill tends to diminish as time increases? Support your answer with a scatterplot. Time (minutes) Mass (pounds) 0 6.64 1 6.34 2 6.04 4 5.47 6 4.94 8 4.44 10 3.98 12 3.55 14 3.15 16 2.79 18 2.45 20 2.14 22 1.86 24 1.60 26 1.37 28 1.17 30 0.98 35 0.60 40 0.34 45 0.17 50 0.06 55 0.02 60 0.00 Source: Based on Barry. J. “Estimating rates of spreading and evaporation of volatile liquids.” Chemical Engineering Progress,. Vol. 101, No. 1. Jan. 2005, p. 38.
Read more -
Chapter 2: Problem 125 Statistics for Business and Economics 12
Problem 125E Does elevation impact hitting performance in baseball? The Colorado Rockies play their Major League home baseball games at Coors Field, Denver. Each year, the Rockies are among the leaders in team batting statistics (e.g., home runs, batting average, and slugging percentage). Many baseball experts attribute this phenomenon to the “thin air” of Denver—called the “mile-high” city due to its elevation. Chance (Winter 2006) investigated the effects of elevation on slugging percentage in Major League Baseball. Data were compiled on players’ composite slugging percentage at each of 29 cities for the 2003 season, as well as each city’s elevation (feet above sea level). The data for selected observations are shown in the table on the next page. Construct a scatterplot of the data for all 29 cities. Do you detect a trend? Date for Exercise 2.125 City Slug Pct. Elevation Anaheim .480 160 Arlington .605 616 Atlanta .530 1,050 Baltimore .505 130 Boston .505 20 : : : Denver .625 5,277 : : : Seattle .550 350 San Francisco .510 63 St. Louis .570 465 Tampa .500 10 Toronto .535 566 Source: Scha::er, J., & Heiny. E. L. “The e::ects o: elevation on slugging percentage in Major League Baseball.” Chance, Vol. 19, No. 1. Winter 2006 (adapted :rom :igure 2, p. 30).
Read more -
Chapter 2: Problem 129 Statistics for Business and Economics 12
Performance ratings of government agencies. The U.S. Office of Management and Budget (OMB) requires government agencies to produce annual performance and accounting reports (PARS) each year. A research team at George Mason University evaluated the quality of the PARS for 24 government agencies (The Public Manager, Summer 2008). Evaluation scores ranged from 12 (lowest) to 60 (highest). The PARS evaluation scores for two consecutive years are shown in the next table. a. Construct a scattergram for the data. Do you detect a trend in the data? b. Based on the graph, identify one or two agencies that had greater than expected PARS evaluation scores for 2008.
Read more -
Chapter 2: Problem 130 Statistics for Business and Economics 12
Most valuable NFL teams. Refer to the Forbes listing of the 2011 values of the 32 teams in the National Football League (NFL), Exercise 2.26 (p. 60). Construct a scatterplot to investigate the relationship between 2011 value ($ millions) and operating income ($ millions). Would you recommend that an NFL executive use operating income to predict a team’s current value? Explain.
Read more -
Chapter 2: Problem 132 Statistics for Business and Economics 12
Ranking driving performance of professional golfers. Refer to The Sport Journal (Winter 2007) analysis of a new method for ranking the total driving performance of golfers on the PGA tour, Exercise 2.50 (p. 72). Recall that the method uses both the average driving distance (yards) and driving accuracy (percent of drives that land in the fairway). Data on these two variables for the top 40 PGA golfers are saved in the accompanying file. A professional golfer is practicing a new swing to increase his average driving distance. However, he is concerned that his driving accuracy will be lower. Is his concern a valid one? Explain.
Read more -
Chapter 2: Problem 134 Statistics for Business and Economics 12
Trend in Iraq War casualties. While the United States was still actively fighting in the Iraq War, a news media outlet produced a graphic showing a dramatic decline in the annual number of American casualties. The number of deaths for the years 2003, 2004, 2005, and 2006 were (approximately) 475, 850, 820, and 130, respectively. a. Create a time series plot showing the dramatic decline in the number of American deaths per year. b. The graphic was based on data collected through February of 2006. Knowing this fact, why is the time series plot misleading? c. What information would you like to have in order to construct a graph that accurately reflects the trend in American casualties from the Iraq War?
Read more -
Chapter 2: Problem 136 Statistics for Business and Economics 12
BP oil leak. In the summer of 2010, an explosion on the Deepwater Horizon oil drilling rig caused a leak in one of British Petroleum (BP) Oil Company’s wells in the Gulf of Mexico. Crude oil rushed unabated for 3 straight months into the Gulf until BP could fix the leak. During the disaster, BP used suction tubes to capture some of the gushing oil. In May of 2011, in an effort to demonstrate the daily improvement in the process, a BP representative presented a graphic on the daily number of 42-gallon barrels (bbl) of oil collected by the suctioning process. A graphic similar to the one used by BP is shown below. a. Note that the vertical axis represents the “cumulative” number of barrels collected per day. This is calculated by adding the amounts of the previous days’ oil collection to the current day’s oil collection. Explain why this graph is misleading. b. Estimates of the actual number of barrels of oil collected per day for each of the 8 days are listed in the accompanying table. Construct a graph for this data that accurately depicts BP’s progress in its daily collection of oil. What conclusions can you draw from the graph?
Read more -
Chapter 2: Problem 135 Statistics for Business and Economics 12
Problem 135E Misleading graph. Consider the following graphic, produced by the Silicon Alley Insider, an online publication for business news. The graph is attempting to show the increasing trend in annual revenue produced by Craigslist as compared to the decrease in newspaper classified ad sales. a. Why might the graph be misleading? [Hint: Focus on the units of measure on the two vertical axes.] b. Redraw the graph, but use the same units of measure for both Craigslist revenue and newspaper ad sales. What conclusions can you draw from the redrawn graph?
Read more -
Chapter 2: Problem 133 Statistics for Business and Economics 12
Museum management. Refer to the Museum Management and Curatorship (June 2010) study of how museums evaluate their performance, Exercise 2.14 (p. 50). Recall that managers of 30 museums of contemporary art identified the performance measure used most often. A summary of the results is reproduced in the table. Consider the bar graph shown. Identify two ways in which the bar graph might mislead the viewer by overemphasizing the importance of one of the performance measures.
Read more -
Chapter 2: Problem 137 Statistics for Business and Economics 12
Construct a relative frequency histogram for the data summarized in the accompanying table.
Read more -
Chapter 2: Problem 138 Statistics for Business and Economics 12
Problem 138SE Discuss the conditions under which the median is preferred to the mean as a measure of central tendency.
Read more -
Chapter 2: Problem 131 Statistics for Business and Economics 12
Doctors and ethics. Refer to the Journal of Medical Ethics (Vol. 32, 2006) study of physicians’ use of ethics consultation, Exercise 2.68 (p. 79). In addition to length of time in practice (i.e., years of experience), the researchers also measured the amount of exposure to ethics in medical school (number of hours) for the sample of 118 physicians. a. Use data from the accompanying file to create a scatterplot for these two variables. Plot years of experience on the vertical axis and amount of exposure to ethics in medical school on the horizontal axis. Comment on the strength of the association between these two variables. b. Conduct an outlier analysis of the data for the variable amount of exposure to ethics in medical school. Identify the highly suspect outlier in the data set. c. Remove the outlier, part b, from the data set and re-create the scatterplot of part a. What do you observe?
Read more -
Chapter 2: Problem 142 Statistics for Business and Economics 12
For each of the following data sets, compute \(\bar{x},\ s^{2},\ \text { and } s\). If appropriate, specify the units in which your answers are expressed. a. 4, 6, 6, 5, 6, 7 b. -$1, $4, -$3, $0, -$3, -$6 c. \(\frac{3}{5}\%\), \(\frac{4}{5}\%\), \(\frac{2}{5}\%\), \(\frac{1}{5}\%\), \(\frac{1}{16}\%\) d. Calculate the range of each data set in parts a–c.
Read more -
Chapter 2: Problem 140 Statistics for Business and Economics 12
Refer to Exercise 2.139. For parts a–d, determine whether the values 50, 70, and 80 are outliers.
Read more -
Chapter 2: Problem 143 Statistics for Business and Economics 12
Problem 143SE Explain why we generally prefer the standard deviation to the range as a measure of variability for quantitative data.
Read more -
Chapter 2: Problem 139 Statistics for Business and Economics 12
Consider the following three measurements: 50, 70, 80. Find the z-score for each measurement if they are from a population with a mean and standard deviation equal to a. \(\mu\) = 60, \(\sigma\) = 10 b. \(\mu\) = 50, \(\sigma\) = 5 c. \(\mu\) = 40, \(\sigma\) = 10 d. \(\mu\) = 40, \(\sigma\) = 100
Read more -
Chapter 2: Problem 141 Statistics for Business and Economics 12
For each of the following data sets, compute \(\bar{x},\ s^2,\ \text{and},\ s\): a. 13, 1, 10, 3, 3 b. 13, 6, 6, 0 c. 1, 0, 1, 10, 11, 11, 15 d. 3, 3, 3, 3
Read more -
Chapter 2: Problem 144 Statistics for Business and Economics 12
If the range of a set of data is 20, find a rough approximation to the standard deviation of the data set.
Read more -
Chapter 2: Problem 145 Statistics for Business and Economics 12
Construct a scattergram for the data in the following table.
Read more -
Chapter 2: Problem 147 Statistics for Business and Economics 12
Business marketing publications. Business-to-business marketing describes the field of marketing between multiple business entities. The Journal of Business-to-Business Marketing (Vol. 15, 2008) produced a pie chart describing the number of business-to-business marketing articles published in all journals, by topical area, between 1971 and 2006. The data used to produce the pie chart are shown in the table. a. Compute the relative frequencies for the nine topical areas shown in the table. Interpret the relative frequency for Buyer Behavior. b. Use the relative frequencies, part a, to construct a pie chart for the data. Why is the slice for Marketing Research smaller than the slice for Sales Management?
Read more -
Chapter 2: Problem 148 Statistics for Business and Economics 12
A boom in U.S. bankruptcies. The American Bankruptcy Institute and the National Bankruptcy Research Center monitor the number of consumer bankruptcy filings each month. The table on the next page lists the number of bankruptcy filings for each of the first 10 months of a recent year. a. Explain why the data in the table represent time series data. b. Construct a time series plot for the monthly number of bankruptcy filings. c. Do you detect a trend in the time series plot? Explain.
Read more -
Chapter 2: Problem 149 Statistics for Business and Economics 12
Crash tests on new cars. The National Highway Traffic Safety Administration (NHTSA) crash-tests new car models to determine how well they protect the driver and front-seat passenger in a head-on collision. The NHTSA has developed a “star” scoring system for the frontal crash test, with results ranging from one star (*) to five stars (*****). The more stars in the rating, the better the level of crash protection in a head-on collision. The NHTSA crash test results for 98 cars (in a recent model year) are stored in the accompanying data file. The driver-side star ratings for the 98 cars are summarized in the Minitab printout shown below. Use the information in the printout to form a pie chart. Interpret the graph.
Read more -
Chapter 2: Problem 146 Statistics for Business and Economics 12
Management system failures. The U.S. Chemical Safety and Hazard Investigation Board (CSB) is responsible for determining the root cause of industrial accidents (Process Safety Progress, Dec. 2004). The accompanying table gives a breakdown of the root causes of 83 incidents caused by management system failures. a. Find the relative frequency of the number of incidents for each cause category. b. Construct a Pareto diagram for the data. c. From the Pareto diagram, identify the cause categories with the highest (and lowest) relative frequency of incidents.
Read more -
Chapter 2: Problem 150 Statistics for Business and Economics 12
Problem 150SE Crash tests on new cars (cont’d). Refer to Exercise 2.149. One quantitative variable recorded by the NHTSA is driver’s severity of head injury (measured on a scale from 0 to 1,500). The mean and standard deviation for the 98 driver head injury ratings are displayed in the Minitab printout below. a. Give a practical interpretation of the mean. b. Use the mean and standard deviation to make a statement about where most of the head-injury ratings fall. c. Find the z-score for a driver head-injury rating of 408. Interpret the result.
Read more -
Chapter 2: Problem 151 Statistics for Business and Economics 12
Problem 151SE Defects in new automobiles. Consider the following data from the automobile industry (adapted from Kane 1989). All cars produced on a particular day were inspected for defects. The 145 defects found were categorized by type as shown in the accompanying table. Defect Type Number Accessories 50 Body 70 Electrical 10 Engine 5 Transmission 10 a. Construct a Pareto diagram for the data. Use the graph to identify the most frequently observed type of defect. b. All 70 car body defects were further classified as to type. The frequencies are provided in the following table. Form a Pareto diagram for type of body defect. (Adding this graph to the original Pareto diagram of part a is called exploding the Pareto diagram.) Interpret the result. What type of body defect should be targeted for special attention? Body Defect Number Chrome 2 Dents 25 Paint 30 Upholstery 10 Windshield 3
Read more -
Chapter 2: Problem 153 Statistics for Business and Economics 12
Vehicle use of an intersection. For each day of last year, the number of vehicles passing through a certain intersection was recorded by a city engineer. One objective of this study was to determine the percentage of days that more than 425 vehicles used the intersection. Suppose the mean for the data was 375 vehicles per day and the standard deviation was 25 vehicles. a. What can you say about the percentage of days that more than 425 vehicles used the intersection? Assume you know nothing about the shape of the relative frequency distribution for the data. b. What is your answer to part a if you know that the relative frequency distribution for the data is mound shaped?
Read more -
Chapter 2: Problem 152 Statistics for Business and Economics 12
“Made in the USA” survey. “Made in the USA” is a claim stated in many product advertisements or on product labels. Advertisers want consumers to believe that their product is manufactured with 100% U.S. labor and materials—which is often not the case. What does “Made in the USA” mean to the typical consumer? To answer this question, a group of marketing professors conducted an experiment at a shopping mall in Muncie, Indiana. (Journal of Global Business, Spring 2002.) They asked every fourth adult entrant to the mall to participate in the study. A total of 106 shoppers agreed to answer the question, “‘Made in the USA’ means what percentage of U.S. labor and materials?” The responses of the 106 shoppers are summarized as follows: 64 shoppers responded 100%; 20 shoppers stated 75 to 99%; 18 shoppers stated 50 to 74%; and 4 shoppers said less than 50%. a. What type of data collection method was used? b. What type of variable, quantitative or qualitative, was measured?. c. Present the data in graphical form. Use the graph to make a statement about the percentage of consumers who believe that “Made in the USA” means 100% U.S. labor and materials.
Read more -
Chapter 2: Problem 154 Statistics for Business and Economics 12
Drivers stopped by police. According to the Bureau of Justice Statistics (June 2006), 75% of all licensed drivers stopped by police are 25 years or older. Give a percentile ranking for the age of 25 years in the distribution of all ages of licensed drivers stopped by police.
Read more -
Chapter 2: Problem 156 Statistics for Business and Economics 12
Problem 156SE Color and clarity of diamonds. Diamonds are categorized according to the “four C’s”: carats, clarity, color, and cut. Each diamond stone that is sold on the open market is provided a certificate by an independent diamond assessor that lists these characteristics. Data for 308 diamonds were extracted from Singapore’s Business Times (Journal of Statistics Education, Vol. 9, No. 1, 2001). Color is classified as D, E, F, G, H, or I, while clarity is classified as IF, VVS1, VVS2, VS1, or VS2. Use a graphical technique to summarize the color and clarity of the 308 diamond stones. What is the color and clarity that occurs most often? Least often?
Read more -
Chapter 2: Problem 155 Statistics for Business and Economics 12
Environmental failures of Arkansas companies. Failure of a corporation to obey both federal and state environmental regulations may result in irreparable damage to the environment and costly financial penalties to the firm. The accompanying table lists the financial penalties (thousands of dollars) assessed in 38 civil actions filed against Arkansas companies by the U.S. Department of Justice and the Environmental Protection Agency. The penalties were assessed for violations of at least one of several different environmental laws, including the Clean Air Act (CAA). (Penalties assessed due to CAA violations are marked with an asterisk in the table.) a. Construct a stem-and-leaf display for all 38 penalties. b. Circle the individual leaves that are associated with penalties imposed for CAA violations. c. What does the pattern of circles in part b suggest about the severity of the penalties imposed for CAA violations relative to the other types of violations reported in the table? Explain.
Read more -
Chapter 2: Problem 157 Statistics for Business and Economics 12
Color and clarity of diamonds (cont’d). Refer to Exercise 2.156. In addition to color and clarity, the independent certification group (GIA, HRD, or IGI) and the number of carats were recorded for each of 308 diamonds for sale on the open market. a. Use a graphical method to describe the carat distribution of all 308 diamonds. b. Use a graphical method to describe the carat distribution of diamonds certified by the GIA group. c. Repeat part b for the HRD and IGI certification groups. d. Compare the three carat distributions, parts b and c. Is there one particular certification group that appears to be assessing diamonds with higher carats than the others? e. Find and interpret the mean of the data set. f. Find and interpret the median of the data set. g. Find and interpret the mode of the data set. h. Which measure of central tendency best describes the 308 carat values? Explain. i. Use the mean and standard deviation to form an interval that will contain at least 75% of the carat values in the data set.
Read more -
Chapter 2: Problem 158 Statistics for Business and Economics 12
Problem 158SE Characteristics of diamonds sold at retail. Refer to Exercise 2.157. In addition to the number of carats, the asking price for each of the 308 diamonds for sale on the open market was recorded. Construct a scatterplot for the data, with number of carats on the horizontal axis and price on the vertical axis. What type of trend do you detect? Color and clarity of diamonds (cont’d). Refer to Exercise 2.156. In addition to color and clarity, the independent certification group (GIA, HRD, or IGI) and the number of carats were recorded for each of 308 diamonds for sale on the open market. a. Use a graphical method to describe the carat distribution of all 308 diamonds. b. Use a graphical method to describe the carat distribution of diamonds certified by the GIA group. c. Repeat part b for the HRD and IGI certification groups. d. Compare the three carat distributions, parts b and c. Is there one particular certification group that appears to be assessing diamonds with higher carats than the others? e. Find and interpret the mean of the data set. f. Find and interpret the median of the data set. g. Find and interpret the mode of the data set. h. Which measure of central tendency best describes the 308 carat values? Explain. i. Use the mean and standard deviation to form an interval that will contain at least 75% of the carat values in the data set. Color and clarity of diamonds. Diamonds are categorized according to the “four C’s”: carats, clarity, color, and cut. Each diamond stone that is sold on the open market is provided a certificate by an independent diamond assessor that lists these characteristics. Data for 308 diamonds were extracted from Singapore’s Business Times (Journal of Statistics Education, Vol. 9, No. 1, 2001). Color is classified as D, E, F, G, H, or I, while clarity is classified as IF, VVS1, VVS2, VS1, or VS2. Use a graphical technique to summarize the color and clarity of the 308 diamond stones. What is the color and clarity that occurs most often? Least often?
Read more -
Chapter 2: Problem 160 Statistics for Business and Economics 12
Software defects. The Promise Software Engineering Repository is a collection of data sets available to serve businesses in building predictive software models. One such data set, saved in the accompanying file, contains information on 498 modules of software code. Each module was analyzed for defects and classified as “true” if it contained defective code and “false” if not. Access the data file and produce a bar graph or a pie chart for the defect variable. Use the graph to make a statement about the likelihood of defective software code.
Read more -
Chapter 2: Problem 159 Statistics for Business and Economics 12
Problem 159SE Hull failures of oil tankers. Owing to several major ocean oil spills by tank vessels, Congress passed the 1990 Oil Pollution Act, which requires all tankers to be designed with thicker hulls. Further improvements in the structural design of a tank vessel have been proposed since then, each with the objective of reducing the likelihood of an oil spill and decreasing the amount of outflow in the event of a hull puncture. To aid in this development, Marine Technology (Jan. 1995) reported on the spillage amount (in thousands of metric tons) and cause of puncture for 42 major oil spills from tankers and carriers. [Note: Cause of puncture is classified as either collision (C), fire/explosion (FE), hull failure (HF), or grounding (G).] The data are saved in the accompanying file. a. Use a graphical method to describe the cause of oil spillage for the 42 tankers. Does the graph suggest that any one cause is more likely to occur than any other? How is this information of value to the design engineers? b. Find and interpret descriptive statistics for the 42 spillage amounts. Use this information to form an interval that can be used to predict the spillage amount of the next major oil spill.
Read more -
Chapter 2: Problem 161 Statistics for Business and Economics 12
Problem 161SE Velocity of Winchester bullets. The American Rifleman (June 1993) reported on the velocity of ammunition fired from the FEG P9R pistol, a 9-mm gun manufactured in Hungary. Field tests revealed that Winchester bullets fired from the pistol had a mean velocity (at 15 feet) of 936 feet per second and a standard deviation of 10 feet per second. Tests were also conducted with Uzi and Black Hills ammunition. a. Describe the velocity distribution of Winchester bullets fired from the FEG P9R pistol. ________________ b. A bullet whose brand is unknown is fired from the FEG P9R pistol. Suppose the velocity (at 15 feet) of the bullet is 1,000 feet per second. Is the bullet likely to be manufactured by Winchester? Explain.
Read more -
Chapter 2: Problem 163 Statistics for Business and Economics 12
Problem 163SE Misleading advertisement. A time series plot similar to the one shown next appeared in a recent advertisement for a well-known golf magazine. One person might interpret the plot’s message as the longer you subscribe to the magazine, the better golfer you should become. Another person might interpret it as indicating that if you subscribe for 3 years, your game should improve dramatically. a. Explain why the plot can be interpreted in more than one way. b. How could the plot be altered to rectify the current distortion?
Read more -
Chapter 2: Problem 162 Statistics for Business and Economics 12
Time to develop price quotes. A manufacturer of industrial wheels is losing many profitable orders because of the long time it takes the firm’s marketing, engineering, and accounting departments to develop price quotes for potential customers. To remedy this problem, the firm’s management would like to set guidelines for the length of time each department should spend developing price quotes. To help develop these guidelines, 50 requests for price quotes were randomly selected from the set of price quotes made last year: the processing time (in days) was determined for each price quote for each department. Several observations are displayed in the table below. The price quotes are also classified by whether or not they were “lost” (i.e., whether or not the customer placed an order after receiving the price quote). Request Number Marketing Engineering Accounting Lost? 1 7.0 6.2 .1 No 2 .4 5.2 .1 No 3 2.4 4.6 .6 No 4 6.2 13.0 .8 Yes 5 4.7 .9 .5 No : : : : : 46 6.4 1.3 6.2 No 47 4.0 2.4 13.5 Yes 48 10.0 5.3 .1 No 49 8.0 14.4 1.9 Yes 50 7.0 10.0 2.0 No a. Construct a stem-and-leaf display for the total processing time for each department. Shade the leaves that correspond to “lost” orders in each of the displays, and interpret each of the displays. b. Using your results from part a, develop “maximum processing time” guidelines for each department that, if followed, will help the firm reduce the number of lost orders. c. Generate summary statistics for the processing times. Interpret the results. d. Calculate the z-score corresponding to the maximum processing time guideline you developed in part b for each department, and for the total processing time. e. Calculate the maximum processing time corresponding to a z-score of 3 for each of the departments. What percentage of the orders exceed these guidelines? How does this agree with Chebyshev’s Rule and the Empirical Rule? f. Repeat part e using a z-score of 2. g. Compare the percentage of “lost” quotes with corresponding times that exceed at least one of the guidelines in part e to the same percentage using the guidelines in part f. Which set of guidelines would you recommend be adopted? Why?
Read more -
Chapter 2: Problem 164 Statistics for Business and Economics 12
History of corporate acquisitions. Refer to the Academy of Management Journal (Aug. 2008) study of corporate acquisitions from 1980 to 2000, Exercise 2.12 (p. 50). a. Construct a time series plot of the number of firms with at least one acquisition. b. For each year, compute the percentage of sampled firms with at least one acquisition. Then construct a time series plot of these percentages. c. Which time series plot, part a or part b, is more informative about the history of corporate acquisitions over time? Explain.
Read more -
Chapter 2: Problem 166 Statistics for Business and Economics 12
Amount of zinc phosphide in commercial rat poison. A chemical company produces a substance composed of 98% cracked corn particles and 2% zinc phosphide for use in controlling rat populations in sugarcane fields. Production must be carefully controlled to maintain the 2% zinc phosphide because too much zinc phosphide will cause damage to the sugarcane and too little will be ineffective in controlling the rat population. Records from past production indicate that the distribution of the actual percentage of zinc phosphide present in the substance is approximately mound-shaped, with a mean of 2.0% and a standard deviation of .08%. a. If the production line is operating correctly, approximately what proportion of batches from a day’s production will contain less than 1.84% of zinc phosphide? b. Suppose one batch chosen randomly actually contains 1.80% zinc phosphide. Does this indicate that there is too little zinc phosphide in today’s production? Explain your reasoning.
Read more -
Chapter 2: Problem 165 Statistics for Business and Economics 12
Problem 165SE Radiation levels in homes. In some locations, radiation levels in homes are measured at well above normal background levels in the environment. As a result, many architects and builders are making design changes to ensure adequate air exchange so that radiation will not be “trapped” in homes. In one such location, 50 homes’, levels were measured, and the mean level was 10 parts per billion (ppb), the median was 8 ppb, and the standard deviation was 3 ppb. Background levels in this location are at about 4 ppb. a. Based on these results, is the distribution of the 50 homes’ radiation levels symmetric, skewed to the left, or skewed to the right? Why? b. Use both Chebyshev’s Rule and the Empirical Rule to describe the distribution of radiation levels. Which do you think is most appropriate in this case? Why? c. Use the results from part b to approximate the number of homes in this sample that have radiation levels above the background level. d. Suppose another home is measured at a location 10 miles from the one sampled and has a level of 20 ppb. What is the z-score for this measurement relative to the 50 homes sampled in the other location? Is it likely that this new measurement comes from the same distribution of radiation levels as the other 50? Why? How would you go about confirming your conclusion?
Read more -
Chapter 2: Problem 168 Statistics for Business and Economics 12
Problem 168SE Investigating the claims of weight-loss clinics. The U.S. Federal Trade Commission assesses fines and other penalties against weight-loss clinics that make unsupported or misleading claims about the effectiveness of their programs. Brochures from two weight-loss clinics both advertise “statistical evidence” about the effectiveness of their programs. Clinic A claims that the mean weight loss during the first month is 15 pounds; Clinic B claims a median weight loss of 10 pounds. a. Assuming the statistics are accurately calculated, which clinic would you recommend if you had no other information? Why? b. Upon further research, the median and standard deviation for Clinic A are found to be 10 pounds and 20 pounds, respectively, while the mean and standard deviation for Clinic B are found to be 10 and 5 pounds, respectively. Both are based on samples of more than 100 clients. Describe the two clinics’ weight-loss distributions as completely as possible given this additional information. What would you recommend to a prospective client now? Why? c. Note that nothing has been said about how the sample of clients upon which the statistics are based was selected. What additional information would be important regarding the sampling techniques employed by the clinics?
Read more -
Chapter 2: Problem 167 Statistics for Business and Economics 12
U.S. peanut production. If not examined carefully, the graphical description of U.S. peanut production shown at the bottom of the page can be misleading. a. Explain why the graph may mislead some readers. b. Construct an undistorted graph of U.S. peanut production for the given years.
Read more -
Chapter 2: Problem 170 Statistics for Business and Economics 12
No Child Left Behind Act. According to the government, federal spending on K-12 education has increased dramatically over the past 20 years, but student performance has essentially stayed the same. Hence, in 2002, President George Bush signed into law the No Child Left Behind Act, a bill that promised improved student achievement for all U.S. children. Chance (Fall 2003) reported on a graphic
Read more -
Chapter 2: Problem 169 Statistics for Business and Economics 12
Problem 169SE Age discrimination study. The Age Discrimination in Employment Act mandates that workers 40 years of age or older be treated without regard to age in all phases of employment (hiring, promotions, firing, etc.). Age discrimination cases are of two types: disparate treatment and disparate impact. In the former, the issue is whether workers have been intentionally discriminated against. In the latter, the issue is whether employment practices adversely affect the protected class (i.e., workers 40 and over) even though no such effect was intended by the employer. A small computer manufacturer laid off 10 of its 20 software engineers. The ages of all engineers at the time of the layoff are shown below. Analyze the data to determine whether the company may be vulnerable to a disparate impact claim.
Read more