
Problem 1DQ For the following processes, is the work done by the system (defined as the expanding or contracting gas) on the environment positive or negative? (a) expansion of the burned gasoline–air mixture in the cylinder of an automobile engine; (b) opening a bottle of champagne; (c) filling a scuba tank with compressed air; (d) partial crumpling of a sealed, empty water bottle as you drive from the mountains down to sea level.
Read moreTable of Contents
1
Units, Physical Quantities, and Vectors
2
Motion Along a Straight Line
3
Work and Kinetic Energy
4
Potential Energy and Energy Conservation
5
Momentum, Impulse, and Collisions
6
Motion in Two or Three Dimensions
7
Rotation of Rigid Bodies
8
Dynamics of Rotational Motion
9
Equilibrium and Elasticity
10
Newton's Laws of Motion
11
Applying Newton's Laws
12
Fluid Mechanics
13
Gravitation
14
Periodic Motion
15
Mechanical Waves
16
Sound and Hearing
17
Temperature and Heat
18
Thermal Properties of Matter
19
The First Law of Thermodynamics
20
The Second Law of Thermodynamics
21
Electric Charge and Electric Field
22
Gauss's Law
23
Electrical Potential
24
Capacitance and Dielectrics
25
Current, Resistance, and Electromotive Force
26
Direct-Current Circuits
Textbook Solutions for University Physics
Chapter 19 Problem 4E
Question
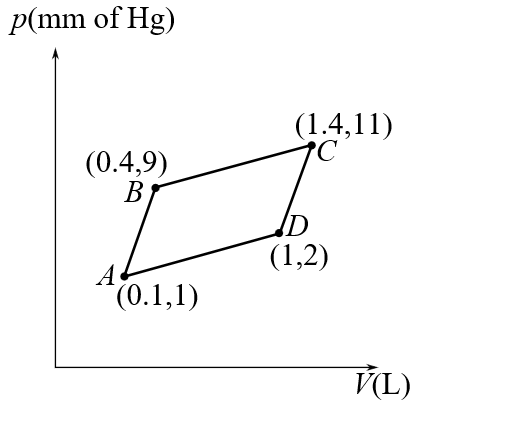
The graph in Fig. E19.4 shows a pV-diagram of the air in a human lung when a person is inhaling and then exhaling a deep breath. Such graphs, obtained in clinical practice, are normally somewhat curved, but we have modeled one as a set of straight lines of the same general shape. (Important: The pressure shown is the gauge pressure, not the absolute pressure.)
(a) How many joules of net work does this person’s lung do during one complete breath?
(b) The process illustrated here is somewhat different from those we have been studying, because the pressure change is due to changes in the amount of gas in the lung, not to temperature changes. (Think of your own breathing. Your lungs do not expand because they’ve gotten hot.) If the temperature of the air in the lung remains a reasonable \(20^{\circ} \mathrm{C}\), what is the maximum number of moles in this person’s lung during a breath?
Solution
Step 1 of 5
According to the ideal gas equation,
pV = nRT
Here, p is the pressure, V is the volume, n represents the number of moles, R is the universal gas constant, and T is the temperature.
Step 2 of 5
Work done is the area under the pV -diagram.
Consider the following diagram,
Step 3 of 5
The y-axis pressure (p) is plotted, and the x-axis volume (V) is plotted.
Subscribe to view the
full solution
full solution
Title
University Physics 13
Author
Hugh D. Young, Roger A. Freedman
ISBN
9780321675460
BIO Work Done by the Lungs. The graph in Fig. E19.4 shows
Chapter 19 textbook questions
-
Chapter 19: Problem 1 University Physics 13
-
Chapter 19: Problem 2 University Physics 13
Problem 2E Six moles of an ideal gas are in a cylinder fitted at one end with a movable piston. The initial temperature of the gas is 27.0o C and the pressure is constant. As part of a machine design project, calculate the final temperature of the gas after it has done 2.40 X 10³ J of work.
Read more -
Chapter 19: Problem 2 University Physics 13
Problem 2DQ It is not correct to say that a body contains a certain amount of heat, yet a body can transfer heat to another body. How can a body give away something it does not have in the first place?
Read more -
Chapter 19: Problem 3 University Physics 13
Problem 3DQ In which situation must you do more work: inflating a balloon at sea level or inflating the same balloon to the same volume at the summit of Mt. McKinley? Explain in terms of pressure and volume change.
Read more -
Chapter 19: Problem 1 University Physics 13
Problem 1E Two moles of an ideal gas are heated at constant pressure from T = 27o C to T = 107o C. (a) Draw a pV-diagram for this process. (b) Calculate the work done by the gas.
Read more -
Chapter 19: Problem 4 University Physics 13
Problem 4DQ If you are told the initial and final states of a system and the associated change in internal energy, can you determine whether the internal energy change was due to work or to heat transfer? Explain.
Read more -
Chapter 19: Problem 69 University Physics 13
Oscillations of a Piston. A vertical cylinder of radius r contains a quantity of ideal gas and is fitted with a piston with mass m that is free to move (Fig.19.69). The piston and the walls of the cylinder are frictionless, and the entire cylinder is placed in a constant-temperature bath. The outside air pressure is \(p_{0}\). In equilibrium, the piston sits at a height h above the bottom of the cylinder. (a) Find the absolute pressure of the gas trapped below the piston when in equilibrium. (b) The piston is pulled up by a small distance and released. Find the net force acting on the piston when its base is a distance h + y above the bottom of the cylinder, where y is much less than h. (c) After the piston is displaced from equilibrium and released, it oscillates up and down. Find the frequency of these small oscillations. If the displacement is not small, are the oscillations simple harmonic? How can you tell?
Read more -
Chapter 19: Problem 3 University Physics 13
Problem 3E CALC Two moles of an ideal gas are compressed in a cylinder at a constant temperature of 65.0o C until the original pressure has tripled. (a) Sketch a pV-diagram for this process. (b) Calculate the amount of work done.
Read more -
Chapter 19: Problem 4 University Physics 13
Problem 4E BIO Work Done by the Lungs. The graph in ?Fig. E19.4 shows a pV-diagram of the air in a human lung when a person is inhaling and then exhaling a deep breath. Such graphs, obtained in clinical practice, are normally somewhat curved, but we have modeled one as a set of straight lines of the same general shape. (?Important?: The pressure shown is the gauge pressure, ?not the absolute pressure.) (a) How many joules of ?net work does this person’s lung do during one complete breath? (b) The process illustrated here is somewhat different from those we have been studying, because the pressure change is due to changes in the amount of gas in the lung, not to temperature changes. (Think of your own breathing. Your lungs do not expand because they’ve gotten hot.) If the temperature of the air in the lung remains a reasonable 20°C, what is the maximum number of moles in this person’s lung during a breath?
Read more -
Chapter 19: Problem 5 University Physics 13
Problem 5DQ Discuss the application of the first law of thermodynamics to a mountaineer who eats food, gets warm and perspires a lot during a climb, and does a lot of mechanical work in raising herself to the summit. The mountaineer also gets warm during the descent. Is the source of this energy the same as the source during the ascent?
Read more -
Chapter 19: Problem 5 University Physics 13
Problem 5E During the time 0.305 mol of an ideal gas undergoes an isothermal compression at 22.0°C. 468 J of work is done on it by the surroundings. (a) If the final pressure is 1.76 atm, what was the initial pressure? (b) Sketch a ?pV?-diagram for the process.
Read more -
Chapter 19: Problem 6 University Physics 13
Problem 6DQ When ice melts at 0o C, its volume decreases. Is the internal energy change greater than, less than, or equal to the heat added? How can you tell?
Read more -
Chapter 19: Problem 6 University Physics 13
Problem 6E A gas undergoes two processes. In the first, the volume remains constant at 0.200 m3 and the pressure increases from 2.00 X 10⁵ Pa to 5.00 X 10⁵ Pa. The second process is a compression to a volume of 0.120 m3 at a constant pressure of 5.00 X 10⁵ Pa. (a) In a pV-diagram, show both processes. (b) Find the total work done by the gas during both processes.
Read more -
Chapter 19: Problem 7 University Physics 13
Problem 7E Work Done in a Cyclic Process. ?(a) In Fig. 19.7a, consider the closed loop Explain.
Read more -
Chapter 19: Problem 7 University Physics 13
Problem 7DQ You hold an inflated balloon over a hot-air vent in your house and watch it slowly expand. You then remove it and let it cool back to room temperature. During the expansion, which was larger: the heat added to the balloon or the work done by the air inside it? Explain. (Assume that air is an ideal gas.) Once the balloon has returned to room temperature, how does the net heat gained or lost by the air inside it compare to the net work done on or by the surrounding air?
Read more -
Chapter 19: Problem 8 University Physics 13
Problem 8DQ You bake chocolate chip cookies and put them, still warm, in a container with a loose (not airtight) lid. What kind of process does the air inside the container undergo as the cookies gradually cool to room temperature (isothermal, isochoric, adiabatic, isobaric, or some combination)? Explain.
Read more -
Chapter 19: Problem 8 University Physics 13
Problem 8E Figure E19.8 shows a pV-diagram for an ideal gas in which its absolute temperature at ?b is one-fourth of its absolute temperature at a . (a) What volume does this gas occupy at point ?b?? (b) How many joules of work was done by or on the gas in this process? Was it done by or on the gas? (c) Did the internal energy of the gas increase or decrease from ?a to ?b?? How do you know? (d) Did heat enter or leave the gas from ?a to ?b?? How do you know?
Read more -
Chapter 19: Problem 9 University Physics 13
Problem 9DQ Imagine a gas made up entirely of negatively charged electrons. Like charges repel, so the electrons exert repulsive forces on each other. Would you expect that the temperature of such a gas would rise, fall, or stay the same in a free expansion? Why?
Read more -
Chapter 19: Problem 9 University Physics 13
Problem 9E A gas in a cylinder expands from a volume of 0.110 m3 to 0.320 m3. Heat flows into the gas just rapidly enough to keep the pressure constant at 1.65 X 10⁵ Pa during the expansion. The total heat added is 1.15 X 10⁵ J. (a) Find the work done by the gas. (b) Find the change in internal energy of the gas. (c) Does it matter whether the gas is ideal? Why or why not?
Read more -
Chapter 19: Problem 10 University Physics 13
Problem 10DQ There are a few materials that contract when their temperature is increased, such as water between 0°C and 4°C. Would you expect ?Cp?, for such materials to be greater or less than CV?? Explain?
Read more -
Chapter 19: Problem 11 University Physics 13
Problem 11DQ When you blow on the back of your hand with your mouth wide open, your breath feels warm. But if you partially close your mouth to form an “o” and then blow on your hand, your breath feels cool. Why?
Read more -
Chapter 19: Problem 10 University Physics 13
Problem 10E Five moles of an ideal monatomic gas with an initial temperature of 127°C expand and, in the process, absorb 1200 J of heat and do 2100 J of work. What is the final temperature of the gas?
Read more -
Chapter 19: Problem 11 University Physics 13
Problem 11E The process ?abc shown in the ?pV?-diagram in ?Fig. E19.11 involves 0.0175 mol of an ideal gas. (a) What was the lowest temperature the gas reached in this process? Where did it occur? (b) How much work was done by or on the gas from ?a to ?b?? From ?b to ?c?? (c) If 215 J of heat was put into the gas during ?abc?, how many of those joules went into internal energy?
Read more -
Chapter 19: Problem 12 University Physics 13
Problem 12DQ An ideal gas expands while the pressure is kept constant. During this process, does heat flow into the gas or out of the gas? Justify your answer.
Read more -
Chapter 19: Problem 12 University Physics 13
Problem 13E Doughnuts: Breakfast of Champions! A typical doughnut contains 2.0 g of protein, 17.0 g of carbohydrates, and 7.0 g of fat. The average food energy values of these substances are 4.0 kcal/g for protein and carbohydrates and 9.0 kcal/g for fat. (a) During heavy exercise, an average person uses energy at a rate of 510 kcal/h. How long would you have to exercise to “work off” one doughnut? (b) If the energy in the doughnut could somehow be converted into the kinetic energy of your body as a whole, how fast could you move after eating the doughnut? Take your mass to be 60 kg, and express your answer in m/s and in km/h.
Read more -
Chapter 19: Problem 13 University Physics 13
Problem 13DQ A liquid is irregularly stirred in a well-insulated container and thereby undergoes a rise in temperature. Regard the liquid as the system. Has heat been transferred? How can you tell? Has work been done? How can you tell? Why is it important that the stirring is irregular? What is the sign of ?U? How can you tell?
Read more -
Chapter 19: Problem 14 University Physics 13
Problem 14DQ When you use a hand pump to inflate the tires of your bicycle, the pump gets warm after a while. Why? What happens to the temperature of the air in the pump as you compress it? Why does this happen? When you raise the pump handle to draw outside air into the pump, what happens to the temperature of the air taken in? Again, why does this happen?
Read more -
Chapter 19: Problem 14 University Physics 13
Problem 14E Boiling Water at High Pressure. When water is boiled at a pressure of 2.00 atm, the heat of vaporization is 2.20 X 10⁶ J/kg and the boiling point is 120o C. At this pressure, 1.00 kg of water has a volume of 1.00 X 10⁻³ m3, and 1.00 kg of steam has a volume of 0.824 m3. (a) Compute the work done when 1.00 kg of steam is formed at this temperature. (b) Compute the increase in internal energy of the water.
Read more -
Chapter 19: Problem 15 University Physics 13
Problem 15DQ In the carburetor of an aircraft or automobile engine, air flows through a relatively small aperture and then expands. In cool, foggy weather, ice sometimes forms in this aperture even though the outside air temperature is above freezing. Why?
Read more -
Chapter 19: Problem 16 University Physics 13
Problem 16DQ On a sunny day, large “bubbles” of air form on the sun-warmed earth, gradually expand, and finally break free to rise through the atmosphere. Soaring birds and glider pilots are fond of using these “thermals” to gain altitude easily. This expansion is essentially an adiabatic process. Why?
Read more -
Chapter 19: Problem 15 University Physics 13
Problem 15E An ideal gas is taken from a to b on the pV-diagram shown in ?Fig. E19.15?. During this process, 700 J of heat is added and the pressure doubles. (a) How much work is done by or on the gas? Explain. (b) How does the temperature of the gas at a com-pare to its temperature at b? Be specific. (c) How does the internal energy of the gas at a compare to the internal energy at b? Be specific and explain.
Read more -
Chapter 19: Problem 16 University Physics 13
Problem 16E A system is taken from state a to state b along the three paths shown in ?Fig. Q19.23?. (a) Along which path is the work done by the system the greatest? The least? (b) If Ub > Ua, along which path is the absolute value of the heat transfer, |Q|, the greatest? For this path, is heat absorbed or liberated by the system? Explain.
Read more -
Chapter 19: Problem 17 University Physics 13
Problem 17DQ The prevailing winds on the Hawaiian island of Kauai blow from the northeast. The winds cool as they go up the slope of Mt. Waialeale (elevation 1523 m), causing water vapor to con-dense and rain to fall. There is much more precipitation at the summit than at the base of the mountain. In fact, Mt. Waialeale is the rainiest spot on earth, averaging 11.7 m of rainfall a year. But what makes the winds cool?
Read more -
Chapter 19: Problem 17 University Physics 13
Problem 17E A thermodynamic system undergoes a cyclic process as shown in ?Fig. Q19.24?. The cycle consists of two closed loops: I and II. (a) Over one complete cycle, does the system do positive or negative work? (b) In each loop, is the net work done by the system positive or negative? (c) Over one complete cycle, does heat flow into or out of the system? (d) In each loop, does heat flow into or out of the system? Explain.
Read more -
Chapter 19: Problem 18 University Physics 13
Problem 18DQ Applying the same considerations as in Question Q19.17, explain why the island of Niihau, a few kilometers to the south-west of Kauai, is almost a desert and farms there need to be irrigated. Q19.17 The prevailing winds on the Hawaiian island of Kauai blow from the northeast. The winds cool as they go up the slope of Mt. Waialeale (elevation 1523 m), causing water vapor to con-dense and rain to fall. There is much more precipitation at the summit than at the base of the mountain. In fact, Mt. Waialeale is the rainiest spot on earth, averaging 11.7 m of rainfall a year. But what makes the winds cool?
Read more -
Chapter 19: Problem 18 University Physics 13
Problem 18E During an isothermal compression of an ideal gas, 335 J of heat must be removed from the gas to maintain constant temperature. How much work is done by the gas during the process?
Read more -
Chapter 19: Problem 19 University Physics 13
Problem 19DQ In a constant-volume process, dU = nCVdT. But in a constant-pressure process, it is ?not true that dU = nCpdT. Why not?
Read more -
Chapter 19: Problem 19 University Physics 13
Problem 19E A cylinder contains 0.250 mol of carbon dioxide (CO2) gas at a temperature of 27.0o C. The cylinder is provided with a frictionless piston, which maintains a constant pressure of 1.00 atm on the gas. The gas is heated until its temperature increases to 127.0o C. Assume that the CO2 may be treated as an ideal gas. (a) Draw a pV-diagram for this process. (b) How much work is done by the gas in this process? (c) On what is this work done? (d) What is the change in internal energy of the gas? (e) How much heat was supplied to the gas? (f) How much work would have been done if the pressure had been 0.50 atm?
Read more -
Chapter 19: Problem 20 University Physics 13
Problem 20DQ When a gas surrounded by air is compressed adiabatically, its temperature rises even though there is no heat input to the gas. Where does the energy come from to raise the temperature?
Read more -
Chapter 19: Problem 20 University Physics 13
A cylinder contains 0.0100 mol of helium at T = \(27.0^{\circ} \mathrm{C}\). (a) How much heat is needed to raise the temperature to \(67.0^{\circ} \mathrm{C}\) while keeping the volume constant? Draw a pV-diagram for this process. (b) If instead the pressure of the helium is kept constant, how much heat is needed to raise the temperature from \(27.0^{\circ} \mathrm{C}\) to \(67.0^{\circ} \mathrm{C}\)? Draw a pV-diagram for this process. (c) What accounts for the difference between your answers to parts (a) and (b)? In which case is more heat required? What becomes of the additional heat? (d) If the gas is ideal, what is the change in its internal energy in part (a)? In part (b)? How do the two answers compare? Why?
Read more -
Chapter 19: Problem 22 University Physics 13
Problem 22DQ 235? 238? The gas used in separating the two uranium isotopes ? U and ? U has the formula UF? . If 6? you added heat at equal rates to a mole of UF? gas and a mole 6f H? gas, which one’s 2 temperature would you expect to rise faster? Explain.
Read more -
Chapter 19: Problem 22 University Physics 13
Problem 22E When a quantity of monatomic ideal gas expands at a constant pressure of 4.00 X 10⁴ Pa, the volume of the gas increases from 2.00 X 10⁻³ m3 to 8.00 X 10⁻³ m3. What is the change in the internal energy of the gas?
Read more -
Chapter 19: Problem 23 University Physics 13
Problem 23E Heat ?Q flows into a monatomic ideal gas, and the volume increases while the pressure is kept constant. What fraction of the heat energy is used to do the expansion work of the gas?
Read more -
Chapter 19: Problem 24 University Physics 13
Problem 24E Three moles of an ideal monatomic gas expands at a constant pressure of 2.50 atm; the volume of the gas changes from 3.20 X 10⁻² m3 to 4.50 X 10⁻² m3. Calculate (a) the initial and final temperatures of the gas; (b) the amount of work the gas does in expanding; (c) the amount of heat added to the gas; (d) the change in internal energy of the gas.
Read more -
Chapter 19: Problem 25 University Physics 13
Problem 25E A cylinder with a movable piston contains 3.00 mol of N2 gas (assumed to behave like an ideal gas). (a) The N2 is heated at constant volume until 1557 J of heat have been added. Calculate the change in temperature. (b) Suppose the same amount of heat is added to the N2, but this time the gas is allowed to expand while remaining at constant pressure. Calculate the temperature change. (c) In which case (a) or (b), is the final internal energy of the N2 higher? how do you know? What accounts for the difference between the two cases.
Read more -
Chapter 19: Problem 26 University Physics 13
Problem 26E Propane gas (C3H8) behaves like an ideal gas with ? = 1.127. Determine the molar heat capacity at constant volume and the molar heat capacity at constant pressure.
Read more -
Chapter 19: Problem 27 University Physics 13
Problem 27E CALC The temperature of 0.150 mol of an ideal gas is held constant at 77.0o C while its volume is reduced to 25.0% of its initial volume. The initial pressure of the gas is 1.25 atm. (a) Determine the work done by the gas. (b) What is the change in its internal energy? (c) Does the gas exchange heat with its surroundings? If so, how much? Does the gas absorb or liberate heat?
Read more -
Chapter 19: Problem 28 University Physics 13
An experimenter adds 970 J of heat to 1.75 mol of an ideal gas to heat it from \(10.0^{\circ} \mathrm{C}\) to \(25.0^{\circ} \mathrm{C}\) at constant pressure. The gas does + 223 J of work during the expansion. (a) Calculate the change in internal energy of the gas. (b) Calculate \(\gamma\) for the gas.
Read more -
Chapter 19: Problem 29 University Physics 13
Problem 29E Problem A monatomic ideal gas that is initially at 1.50 X 10⁵ Pa and has a volume of 0.0800 m3 is compressed adiabatically to a volume of 0.0400 m3. (a) What is the final pressure? (b) How much work is done by the gas? (c) What is the ratio of the final temperature of the gas to its initial temperature? Is the gas heated or cooled by this compression?
Read more -
Chapter 19: Problem 30 University Physics 13
Problem 30E In an adiabatic process for an ideal gas, the pressure decreases. In this process does the internal energy of the gas increase or decrease? Explain your reasoning.
Read more -
Chapter 19: Problem 31 University Physics 13
Problem 31E Two moles of carbon monoxide (CO) start at a pressure 1.2 atm and a volume of 30 liters. The gas is then compressed adiabatically to this volume. Assume that the gas may he treated as ideal. What is the change in the internal energy of the gas? Does the internal energy increase or decrease? Does the temperature of the gas increase or decrease during this process? Explain
Read more -
Chapter 19: Problem 32 University Physics 13
Problem 32E The engine of a Ferrari F355 F1 sports car takes in air at 20.0o C and 1.00 atm and compresses it adiabatically to 0.0900 times the original volume. The air may be treated as an ideal gas with ? = 1.40. (a) Draw a pV-diagram for this process. (b) Find the final temperature and pressure.
Read more -
Chapter 19: Problem 34 University Physics 13
Problem 34E A player bounces a basketball on the floor, compressing it to 80.0% of its original volume. The air (assume it is essentially N2 gas) inside the ball is originally at 20.0o C and 2.00 atm. The ball’s inside diameter is 23.9 cm. (a) What temperature does the air in the ball reach at its maximum compression? Assume the compression is adiabatic and treat the gas as ideal. (b) By how much does the internal energy of the air change between the ball’s original state and its maximum compression?
Read more -
Chapter 19: Problem 36 University Physics 13
Problem 36E A cylinder contains 0.100 mol of an ideal monatomic gas. Initially the gas is at 1.00 X 10⁵ Pa and occupies a volume of 2.50 X 10⁻³ m3. (a) Find the initial temperature of the gas in kelvins. (b) If the gas is allowed to expand to twice the initial volume, find the final temperature (in kelvins) a
Read more -
Chapter 19: Problem 35 University Physics 13
On a warm summer day, a large mass of air (atmospheric pressure \(1.01 \times 10^{5}\) Pa) is heated by the ground to \(26.0^{\circ}\)C and then begins to rise through the cooler surrounding air. (This can be treated approximately as an adiabatic process; why?) Calculate the temperature of the air mass when it has risen to a level at which atmospheric pressure is only \(0.850 \times 10^{5}\) Pa. Assume that air is an ideal gas, with \(\gamma=1.40\). (This rate of cooling for dry, rising air, corresponding to roughly \(1^{\circ}\)C per 100 m of altitude, is called the dry adiabatic lapse rate.)
Read more -
Chapter 19: Problem 37 University Physics 13
Problem 37P One mole of ideal gas is slowly compressed to one-third of its original volume. In this compression, the work done on the gas has magnitude 600 J. For the gas, C?p = 7?R?/2. (a) If the process is isothermal, what is the heat flow ?Q for the gas? Does heat flow into or out of the gas? (b) If the process is isobaric, what is the change in internal energy of the gas? Does the internal energy increase or decrease?
Read more -
Chapter 19: Problem 39 University Physics 13
Problem 39P A quantity of air is taken from state a to state b along a path that is a straight line in the pV-diagram (?Fig. P19.33?). (a) In this process, does the temperature of the gas increase, decrease, or stay the same? Explain. (b) If Va = 0.0700 m3, Vb = 0.1100 m3, pa = 1.00 X 10⁵ Pa, and pb = 1.40 X 10⁵ Pa, what is the work W done by the gas in this process? Assume that the gas may be treated as ideal.
Read more -
Chapter 19: Problem 38 University Physics 13
CALC Figure P19.38 shows the pV-diagram for an isothermal expansion of 1.50 mol of an ideal gas, at a temperature of 15.0°C. (a) What is the change in internal energy of the gas? Explain. (b) Calculate the work done by (or on) the gas and the heat absorbed (or released) by the gas during the expansion.
Read more -
Chapter 19: Problem 40 University Physics 13
One-half mole of an ideal gas is taken from state \(a\) to state \(c\), as shown in Fig. P19.40. (a) Calculate the final temperature of the gas. (b) Calculate the work done on (or by) the gas as it moves from state \(a\) to state \(c\). (c) Does heat leave the system or enter the system during this process? How much heat? Explain.
Read more -
Chapter 19: Problem 42 University Physics 13
A thermodynamic system is taken from state a to state c in Fig. P19.42 along either path abc or path adc. Along path abc, the work W done by the system is 450 J. Along path adc, W is 120 J. The internal energies of each of the four states shown in the figure are \(U_{a}=150 \mathrm{~J}\), \(U_{b}=240 \mathrm{~J}, \quad U_{c}=680 \mathrm{~J}\), and \(U_{d}=330 \mathrm{~J}\). Calculate the heat flow Q for each of the four processes ab, bc, ad, and dc. In each process, does the system absorb or liberate heat?
Read more -
Chapter 19: Problem 41 University Physics 13
Problem 41P When a system is taken from state a to state b in ?Fig. P19.37 along path ?acb?, 90.0 J of heat flows into the sys-tem and 60.0 J of work is done by the system. (a) How much heat flows into the system along path ?adb if the work done by the system is 15.0 J? (b) When the system is returned from b to a along the curved path, the absolute value of the work done by the system is 35.0 J. Does the system absorb or liberate heat? How much heat? (c) If Ua = 0 and Ud = 8.0 J, find the heat absorbed in the processes ?ad? and ?db?.
Read more -
Chapter 19: Problem 43 University Physics 13
A volume of air (assumed to be an ideal gas) is first cooled without changing its volume and then expanded without changing its pressure, as shown by the path abc in Fig. P19.43. (a) How does the final temperature of the gas compare with its initial temperature? (b) How much heat does the air exchange with its surroundings during the process abc? Does the air absorb heat or release heat during this process? Explain. (c) If the air instead expands from state a to state c by the straight-line path shown, how much heat does it exchange with its surroundings?
Read more -
Chapter 19: Problem 44 University Physics 13
Problem 44P Three moles of argon gas (assumed to be an ideal gas) originally at 1.50 X 10⁴ Pa and a volume of 0.0280 m3 are first heated and expanded at constant pressure to a volume of 0.0435 m3, then heated at constant volume until the pressure reaches 3.50 X 10⁴ Pa, then cooled and compressed at constant pressure until the volume is again 0.0280 m3, and finally cooled at constant volume until the pressure drops to its original value of 1.50 X 10⁴ Pa. (a) Draw the pV-diagram for this cycle. (b) Calculate the total work done by (or on) the gas during the cycle. (c) Calculate the net heat exchanged with the surroundings. Does the gas gain or lose heat overall?
Read more -
Chapter 19: Problem 45 University Physics 13
Two moles of an ideal monatomic gas go through the cycle abc. For the complete cycle, 800 J of heat flows out of the gas. Process ab is at constant pressure, and process bc is at constant volume. States a and b have temperatures \(T_{a}=200 \mathrm{~K}\) and \(T_{b}=300 \mathrm{~K}\). (a) Sketch the pV-diagram for the cycle. (b) What is the work W for the process ca?
Read more -
Chapter 19: Problem 46 University Physics 13
Problem 46P Three moles of an ideal gas are taken around cycle ?acb shown in ?Fig. P19.42?. For this gas, Cp = 29.1 J / mol ? K. Process ac is at constant pressure, process ?ba is at constant volume, and process ?cb is adiabatic. The temperatures of the gas in states ?a?, ?c?, and ?b are Ta = 300 K, Tc = 492 K, and Tb = 600 K. Calculate the total work ?W for the cycle.
Read more -
Chapter 19: Problem 47 University Physics 13
Problem 47P Figure P19.43 shows a p ? V -diagram for 0.0040 mol of ?ideal H 2 gas. The temperature of the gas does not change during segment ?bc?. (a) What volume does this gas occupy at point c? (b) Find the temperature of the gas at points ?a?, ?b?, and ?c?. (c) How much heat went into or out of the gas during segments ?ab?, ?ca?, and ?bc?? Indicate whether the heat has gone into or out of the gas. (d) Find the change in the internal energy of this hydrogen during segments ?ab?, ?bc?, and ?ca?. Indicate whether the internal energy increased or decreased during each segment.
Read more -
Chapter 19: Problem 48 University Physics 13
Problem 48P The graph in ?Fig. P19.36 shows a pV-diagram for 3.25 mol of ?ideal helium (He) gas. Part ?ca of this process is isothermal. (a) Find the pressure of the He at point ?a?. (b) Find the temperature of the He at points ?a?, ?b?, and ?c?. (c) How much heat entered or left the He during segments ?ab?, ?bc?, and ?ca?? In each segment, did the heat enter or leave? (d) By how much did the internal energy of the He change from ?a to ?b?, from ?b to ?c?, and from ?c to a?? Indicate whether this energy increased or decreased.
Read more -
Chapter 19: Problem 49 University Physics 13
Problem 49P (a) One-third of a mole of He gas is taken along the path ?abc shown in ?Fig. P19.44?. Assume that the gas may be treated as ideal. How much heat is transferred into or out of the gas? (b) If the gas instead went directly from state a to state c along the horizontal dashed line in ?Fig. P19.44?, how much heat would be transferred into or out of the gas? (c) How does Q in part (b) compare with Q in part (a)? Explain.
Read more -
Chapter 19: Problem 50 University Physics 13
Problem 50P Two moles of helium are initially at a temperature of 27.0°C and occupy a volume of 0.0300 m? . The helium first expands at constant pressure until its volume has doubled. Then it expands adiabatically until the temperature returns to its initial value. Assume that the helium can be treated as an ideal gas (a) Draw a diagram of the process in the ?pV – plane. (b)What is the total heat supplied to the helium in the process? (c) What is the total change in internal energy of the helium? (d) What is the total work done by the helium? (e) What is the final volume of the helium?
Read more -
Chapter 19: Problem 51 University Physics 13
Problem 51P Starting with 2.50 mol of N2 gas (assumed to be ideal) in a cylinder at 1.00 atm and 20.0°C, a chemist first heats the gas at volume, adding 1.52 × 10⁴ J of heat, then continues heating and allows the gas to expand at constant pressure to twice its original volume. (a) Calculate the final temperature of the gas. (b). Calculate the amount of work done by the gas. (c) Calculate the amount of heat added to the gas while it was expanding (d) Calculate the change in internal energy of the gas for the whole process.
Read more -
Chapter 19: Problem 52 University Physics 13
Problem 52P Nitrogen gas in an expandable container is cooled from 50.0o C to 10.0o C with the pressure held constant at 3.00 X 10⁵ Pa. The total heat liberated by the gas is 2.50 X 10⁴ J. Assume that the gas may be treated as ideal. Find (a) the number of moles of gas; (b) the change in internal energy of the gas; (c) the work done by the gas. (d) How much heat would be liberated by the gas for the same temperature change if the volume were constant?
Read more -
Chapter 19: Problem 53 University Physics 13
Problem 53P In a certain process, 2.15 × 10⁵ J of heat is liberated by a system. and at the same time the system contracts under a constant external pressure of 9.50 × 10⁵ Pa. The internal energy of the system is the same at the beginning and end of the process. Find the change in volume of the system. (The system is ?not? an ideal gas.)
Read more -
Chapter 19: Problem 54 University Physics 13
Problem 54P CALC A cylinder with a frictionless, movable piston like that shown in Fig. 19.5 contains a quantity of helium gas. Initially the gas is at 1.00 X 10⁵ Pa and 300 K and occupies a volume of 1.50 L. The gas then undergoes two processes. In the first, the gas is heated and the piston is allowed to move to keep the temperature at 300 K. This continues until the pressure reaches 2.50 X 10⁴ Pa. In the second process, the gas is compressed at constant pressure until it returns to its original volume of 1.50 L. Assume that the gas may be treated as ideal. (a) In a pV-diagram, show both processes. (b) Find the volume of the gas at the end of the first process, and the pressure and temperature at the end of the second process. (c) Find the total work done by the gas during both processes. (d) What would you have to do to the gas to return it to its original pressure and temperature?
Read more -
Chapter 19: Problem 55 University Physics 13
Problem 55P A Thermodynamic Process ?in ?a Liquid?. A chemical engineer is studying the properties of liquid methanol (CH3OH). She uses a steel cylinder with a cross-sectional area of 0200 m2 and containing 1.20× 10?2 m3 of methanol. The cylinder is equipped with a tightly fitting piston that supports a loud of 3.00 × 10⁴ N. The temperature of the system is increased from 20.0°C to 50.0°C. For methanol, the coefficient of volume expansion is 1.20 × 10?3 K?1, the density is 791 kg/m3, and the specific heat at constant pressure is ?cp = 2.51 × 10³ J/kg · K. You can ignore the expansion of the steel cylinder. Find (a) the increase in volume of the methanol; (b) the mechanical work done by the methanol against the 3.00 × 10⁴ N force; (c) the amount of heat added to the methanol; (d) the change in internal energy of the methanol. (e) Based on your results, explain whether there is any substantial difference between the specific heats ?cp (at constant Pressure) and cv? (at constant volume) for methanol under these conditions
Read more -
Chapter 19: Problem 56 University Physics 13
Problem 56P CP ?A Thermodynamic Process in a Solid. A cube of copper 2.00 cm on a side is suspended by a string. (The physical properties of copper are given in Tables 14.1, 17.2, and 17.3.) The cube is heated with a burner from 20.0o C to 90.0o C. The air surrounding the cube is at atmospheric pressure (1.01 X 10⁵ Pa). Find (a) the increase in volume of the cube; (b) the mechanical work done by the cube to expand against the pressure of the sur-rounding air; (c) the amount of heat added to the cube; (d) the change in internal energy of the cube. (e) Based on your results, explain whether there is any substantial difference between the specific heats cp (at constant pressure) and cV (at constant volume) for copper under these conditions.
Read more -
Chapter 19: Problem 58 University Physics 13
Problem 58P High-Altitude Research. A large research balloon containing 2.00 X 10³ m3 of helium gas at 1.00 atm and a temperature of 15.0o C rises rapidly from ground level to an altitude at which the atmospheric pressure is only 0.900 atm (?Fig. P19.50?). Assume the helium behaves like an ideal gas and the balloon’s ascent is too rapid to permit much heat exchange with the surrounding air. (a) Calculate the volume of the gas at the higher altitude. (b) Calculate the temperature of the gas at the higher altitude. (c) What is the change in internal energy of the helium as the balloon rises to the higher altitude?
Read more -
Chapter 19: Problem 57 University Physics 13
Problem 57P A Thermodynamic Process ?in ?an Insect?. The African bombardier beetle (?Stenaptinus insignis?) can emit a jet of defensive spray from the movble tip of its abdomen (Fig. P19.57). The beetle’s body has reservoirs of two different chemicals; when the beetle is disturbed, these chemicals are combined in a reaction chamber, producing a compound that is warmed from 20°C to 100°C by the heat of reaction. The high pressure produced allows the compound to be sprayed out at speeds up to 19 m/s (68 km/h), scaring away predators of all kinds. (The beetle shown in the figure is 2 cm long.) Calculate the heat of reaction of the two chemicals (in J/kg). Assume that the specific heat of the two chemicals and the spray is the same as that of water, 4.19 × 10³ J/kg · K, and that the initial temperature of the chemicals is 20°C. Figure P19.57
Read more -
Chapter 19: Problem 59 University Physics 13
Problem 59P Chinook?. During certain seasons strong winds called chinooks blow from the west across the eastern slopes of the Rockies and downhill into Denver and nearby areas. Although the mountains are cool, the wind in Denver is very hot; within a few minutes after the chinook wind arrives, the temperature can climb 20 Co (“chinook” refers to a Native American people of the Pacific Northwest). Similar winds occur in the Alps (called foehns) and in southern California (called Santa Anas). (a) Explain why the temperature of the chinook wind rises as it descends the slopes. Why is it important that the wind be fast moving? (b) Suppose a strong wind is blowing toward Denver (elevation 1630 m) from Grays Peak (80 km west of Denver, at an elevation of 4350 m), where the air pressure is 5.60 X 10⁴ Pa and the air temperature is - 15.0o C. The temperature and pressure in Denver before the wind arrives are 2.0o C and 8.12 X 10⁴ Pa. By how many Celsius degrees will the temperature in Denver rise when the chinook arrives?
Read more -
Chapter 19: Problem 60 University Physics 13
A certain ideal gas has molar heat capacity at constant volume \(C_V\). A sample of this gas initially occupies a volume \(V_0\) at pressure \(p_0\) and absolute temperature \(T_0\). The gas expands isobarically to a volume \(2 V_0\) and then expands further adiabatically to a final volume \(4 V_0\). (a) Draw a \(p V\)-diagram for this sequence of processes. (b) Compute the total work done by the gas for this sequence of processes. (c) Find the final temperature of the gas. (d) Find the absolute value \(|Q|\)of the total heat flow into or out of the gas for this sequence of processes, and state the direction of heat flow.
Read more -
Chapter 19: Problem 62 University Physics 13
Engine Turbochargers and Intercoolers. The power output of an automobile engine is directly proportional to the mass of air that can be forced into the volume of the engine's cylinders to react chemically with gasoline. Many cars have a turbocharger, which compresses the air before it enters the engine, giving a greater mass of air per volume. This rapid, essentially adiabatic compression also heats the air. To compress it further, the air then passes through an intercooler in which the air exchanges heat with its surroundings at essentially constant pressure. The air is then drawn into the cylinders. In a typical installation, air is taken into the turbocharger at atmospheric pressure \(\left(1.01 \times 10^5 \mathrm{~Pa}\right)\), density \(\rho=1.23 \mathrm{~kg} / \mathrm{m}^3\), and temperature \(15.0^{\circ} \mathrm{C}\). It is compressed adiabatically to \(1.45 \times 10^5 \mathrm{~Pa}\). In the intercooler, the air is cooled to the original temperature of \(15.0^{\circ} \mathrm{C}\) at a constant pressure of \(1.45 \times 10^5 \mathrm{~Pa}\). (a) Draw a \(p V\)-diagram for this sequence of processes. (b) If the volume of one of the engine's cylinders is \(575 \mathrm{~cm}^3\), what mass of air exiting from the intercooler will fill the cylinder at \(1.45 \times 10^5 \mathrm{~Pa}\)? Compared to the power output of an engine that takes in air at \(1.01 \times 10^5 \mathrm{~Pa}\) at \(15.0^{\circ} \mathrm{C}\), what percentage increase in power is obtained by using the turbocharger and intercooler? (c) If the intercooler is not used, what mass of air exiting from the turbocharger will fill the cylinder at \(1.45 \times 10^5 \mathrm{~Pa}\)? Compared to the power output of an engine that takes in air at \(1.01 \times 10^5 \mathrm{~Pa}\) at \(15.0^{\circ} \mathrm{C}\), what percentage increase in power is obtained by using the turbocharger alone?
Read more -
Chapter 19: Problem 61 University Physics 13
Problem 61P An air pump has a cylinder 0.250 m long with a movable piston. The pump is used to compress air from the atmosphere (at absolute pressure 1.01 X 10⁵ Pa) into a very large tank at 3.80 X 10⁵ Pa gauge pressure. (For air, CV = 20.8 J / mol ? K.) (a) The piston begins the compression stroke at the open end of the cylinder. How far down the length of the cylinder has the piston moved when air first begins to flow from the cylinder into the tank? Assume that the compression is adiabatic. (b) If the air is taken into the pump at 27.0o C, what is the temperature of the compressed air? (c) How much work does the pump do in putting 20.0 mol of air into the tank?
Read more -
Chapter 19: Problem 63 University Physics 13
Problem 63P A monatomic ideal gas expands slowly to twice its original volume, doing 300 J of work in the process. Find the heat added to the gas and the change in internal energy of the gas if the process is (a) isothermal; (b) adiabatic; (c) isobaric.
Read more -
Chapter 19: Problem 64 University Physics 13
Problem 64P CALC A cylinder with a piston contains 0.250 mol of oxygen at 2.40 X 10⁵ Pa and 355 K. The oxygen may be treated as an ideal gas. The gas first expands isobarically to twice its original volume. It is then compressed isothermally back to its original volume, and finally it is cooled isochorically to its original pressure. (a) Show the series of processes on a pV-diagram. Compute (b) the temperature during the isothermal compression; (c) the maximum pressure; (d) the total work done by the piston on the gas during the series of processes.
Read more -
Chapter 19: Problem 66 University Physics 13
Problem 66P CALC A cylinder with a piston contains 0.150 mol of nitrogen at 1.80 X 10⁵ Pa and 300 K. The nitrogen may be treated as an ideal gas. The gas is first compressed isobarically to half its original volume. It then expands adiabatically back to its original volume, and finally it is heated isochorically to its original pressure. (a) Show the series of processes in a pV-diagram. (b) Compute the temperatures at the beginning and end of the adiabatic expansion. (c) Compute the minimum pressure.
Read more -
Chapter 19: Problem 65 University Physics 13
Problem 65P Use the conditions and processes of Problem 19.54 to compute (a) the work done by the gas, the heat added to it, and its internal energy change during the initial expansion; (b) the work done, the heat added, and the internal energy change during the final cooling; (c) the internal energy change during the isothermal compression. 19.54 .. ?CALC A cylinder with a piston contains 0.250 mol of oxygen at 2.40 X 10⁵ Pa and 355 K. The oxygen may be treated as an ideal gas. The gas first expands isobarically to twice its original volume. It is then compressed isothermally back to its original volume, and finally it is cooled isochorically to its original pressure. (a) Show the series of processes on a pV-diagram. Compute (b) the temperature during the isothermal compression; (c) the maximum pressure; (d) the total work done by the piston on the gas during the series of processes.
Read more -
Chapter 19: Problem 67 University Physics 13
Problem 67P Use the conditions and processes of Problem 19.56 to compute (a) the work done by the gas, the heat added to it, and its internal energy change during the initial compression; (b) the work done by the gas, the heat added to it, and its internal energy change during the adiabatic expansion; (c) the work done, the heat added, and the internal energy change during the final heating. 19.56 .. ?CALC? A cylinder with a piston contains 0.150 mol of nitrogen at 1.80 X 10⁵ Pa and 300 K. The nitrogen may be treated as an ideal gas. The gas is first compressed isobarically to half its original volume. It then expands adiabatically back to its original volume, and finally it is heated isochorically to its original pressure. (a) Show the series of processes in a pV-diagram. (b) Compute the temperatures at the beginning and end of the adiabatic expansion. (c) Compute the minimum pressure.
Read more -
Chapter 19: Problem 68 University Physics 13
Problem 68P Comparing Thermodynamic Processes. In a cylinder, 1.20 mol of an ideal monatomic gas, initially at 3.60 X 10⁵ Pa and 300 K, expands until its volume triples. Compute the work done by the gas if the expansion is (a) isothermal; (b) adiabatic; (c) isobaric. (d) Show each process in a pV-diagram. In which case is the absolute value of the work done by the gas greatest? Least? (e) In which case is the absolute value of the heat transfer greatest? Least? (f) In which case is the absolute value of the change in internal energy of the gas greatest? Least?
Read more