Solution Found!
Solution: Interpreting Normal Quantité Plots. In Exercises,
Chapter 6, Problem 8BSC(choose chapter or problem)
QUESTION:
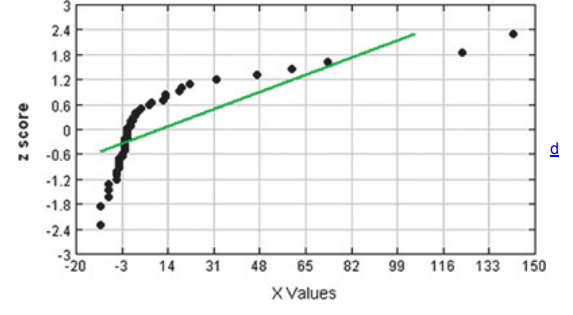
Interpreting Normal Quantile Plots. In Exercises 5–8, examine the normal quantile plot and determine whether the sample data appear to be from a population with a normal distribution.
Flight Departure Delays The normal quantile plot represents flight departure delay times (minutes) from Data Set 15 in Appendix B.
Questions & Answers
QUESTION:
Interpreting Normal Quantile Plots. In Exercises 5–8, examine the normal quantile plot and determine whether the sample data appear to be from a population with a normal distribution.
Flight Departure Delays The normal quantile plot represents flight departure delay times (minutes) from Data Set 15 in Appendix B.
ANSWER:
Answer :
Step 1 of 1 :