Histogram Table 22 is a frequency distribution summarizing the IQ scores of the low lead group listed in Table 21, and Figure 22 is a histogram depicting that same data set. When trying to better understand the IQ data, what is the advantage of examining the histogram instead of the frequency distribution?
Read moreTable of Contents
cc
1
Introduction to Statistics
1-2
Statistical and Critical Thinking
1-3
Types of Data
1-4
Collecting Sample Data
1.2
Statistical and Critical Thinking
1.3
Types of Data
1.4
Collecting Sample Data
2
Summarizing and Graphing
2-2
Frequency Distributions
2-3
Histograms
2-4
Graphs That Enlighten and Graphs That Deceive
2.2
Frequency Distributions
2.3
Histograms
2.4
Graphs That Enlighten and Graphs That Deceive
3
Statistics for Describing, Exploring, and Comparing Data
3-2
Measures of Center
3-3
Measures of Variation
3-4
Measures of Relative Standing and Boxplots
3.2
Measures of Center
3.3
Measures of Variation
3.4
Measures of Relative Standing and Boxplots
4
Probability
4-2
Basic Concepts of Probability
4-3
Addition Rule
4-4
Multiplication Rule: Basics
4-5
Multiplication Rule: Complements and Conditional Probability
4-6
Counting
4.2
Basic Concepts of Probability
4.3
Addition Rule
4.4
Multiplication Rule: Basics
4.5
Multiplication Rule: Complements and Conditional Probability
4.6
Counting
4.7
Probabilities Through Simulations (on CD-ROM)
4.8
Bayes' Theorem (on CD-ROM)
5
Discrete Probability Distributions
5-2
Probability Distributions
5-3
Binomial Probability Distributions
5-4
Parameters for Binomial Distributions
5-5
Poisson Probability Distributions
5.2
Probability Distributions
5.3
Binomial Probability Distributions
5.4
Parameters for Binomial Distributions
5.5
Poisson Probability Distributions
6
Normal Probability Distributions
6-2
The Standard Normal Distribution
6-3
Applications of Normal Distributions
6-4
Sampling Distributions and Estimators
6-5
The Central Limit Theorem
6-6
Assessing Normality
6-7
Normal as Approximation to Binomial
6.2
The Standard Normal Distribution
6.3
Applications of Normal Distributions
6.4
Sampling Distributions and Estimators
6.5
The Central Limit Theorem
6.6
Assessing Normality
6.7
Normal as Approximation to Binomial
7
Estimates and Sample Sizes
7-2
Estimating a Population Proportion
7-3
Estimating a Population Mean
7-4
Estimating a Population Standard Deviation or Variance
7.2
Estimating a Population Proportion
7.3
Estimating a Population Mean
7.4
Estimating a Population Standard Deviation or Variance
8
Hypothesis Testing
8-2
Basics of Hypothesis Testing
8-3
Testing a Claim About a Proportion
8-4
Testing a Claim About a Mean
8-5
Testing a Claim About a Standard Deviation or Variance
8.2
Basics of Hypothesis Testing
8.3
Testing a Claim About a Proportion
8.4
Testing a Claim About a Mean
8.5
Testing a Claim About a Standard Deviation or Variance
9
Inferences from Two Samples
9-2
Two Proportions
9-3
Two Means: Independent Samples
9-4
Two Dependent Samples (Matched Pairs)
9-5
Two Variances or Standard Deviations
9.2
Two Proportions
9.3
Two Means: Independent Samples
9.4
Two Dependent Samples (Matched Pairs)
9.5
Two Variances or Standard Deviations
10
Correlation and Regression
10-2
Correlation
10-3
Regression
10-4
Prediction Intervals and Variation
10-5
Multiple Regression
10-6
Nonlinear Regression
10.2
Correlation
10.3
Regression
10.4
Prediction Intervals and Variation
10.5
Multiple Regression
10.6
Nonlinear Regression
11
Goodness-of-Fit and Contingency Tables
11-2
Goodness-of-Fit
11-3
Contingency Tables
11.2
Goodness-of-Fit
11.3
Contingency Tables
12
Analysis of Variance
12-2
One-Way ANOVA
12-3
Two-Way ANOVA
12.2
One-Way ANOVA
12.3
Two-Way ANOVA
13
Nonparametric Tests
13-3
Wilcoxon Signed-Ranks Test for Matched Pairs
13-4
Wilcoxon Rank-Sum Test for Two Independent Samples
13-5
Kruskal-Wallis Test
13-6
Rank Correlation
13-7
Runs Test for Randomness
13.2
Sign Test
13.2
Sign Test
13.3
Wilcoxon Signed-Ranks Test for Matched Pairs
13.4
Wilcoxon Rank-Sum Test for Two Independent Samples
13.5
Kruskal-Wallis Test
13.6
Rank Correlation
13.7
Runs Test for Randomness
14
Statistical Process Control
14-2
Control Charts for Variation and Mean
14-3
Control Charts for Attributes
14.2
Control Charts for Variation and Mean
14.3
Control Charts for Attributes
Textbook Solutions for Elementary Statistics
Chapter 2-3 Problem 1
Question
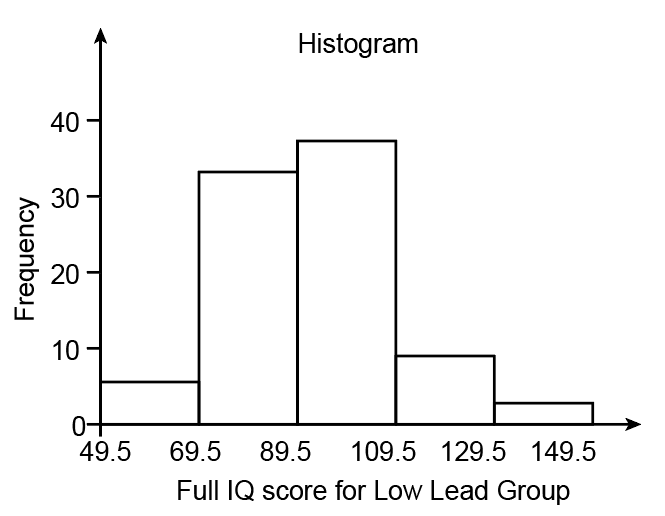
Histogram Table 22 is a frequency distribution summarizing the IQ scores of the low lead group listed in Table 21, and Figure 22 is a histogram depicting that same data set. When trying to better understand the IQ data, what is the advantage of examining the histogram instead of the frequency distribution?
Solution
Step 1 of 2
Given a frequency distribution summarizing the IQ scores of the low lead group, and a histogram depicting that same data set.
The frequency distribution table for the given data is
IQ Score |
frequency |
50-69 |
2 |
70-89 |
33 |
90-109 |
35 |
110-129 |
7 |
130-149 |
1 |
The histogram for the given data
From the graphical representation of the IQ score of the low lead group, the interval 130-149 has less frequency of 1, and the interval 90-109 has the maximum frequency of 35. Also, the histogram is symmetric.
Subscribe to view the
full solution
full solution
Title
Elementary Statistics 12
Author
Mario F. Triola
ISBN
9780321836960
Histogram Table 22 is a frequency distribution summarizing the IQ scores of the low lead
Chapter 2-3 textbook questions
-
Chapter 2: Problem 1 Elementary Statistics 12
-
Chapter 2: Problem 2 Elementary Statistics 12
Voluntary Response Sample The histogram in Figure 22 on page 55 is constructed from a simple random sample of children. If you construct a histogram with data collected from a voluntary response sample, will the distribution depicted in the histogram reflect the true distribution of the population? Why or why not?
Read more -
Chapter 2: Problem 3 Elementary Statistics 12
Small Data NASA provides these duration times (in minutes) of all flights of the space shuttle Challenger: 7224, 8784, 8709, 11,476, 10,060, 11,844, 10,089, 11,445, 10,125, 1. Why does it not make sense to construct a histogram for this data set? What is notable about this data set?
Read more -
Chapter 2: Problem 4 Elementary Statistics 12
Normal Distribution When it refers to a normal distribution, does the term normal have the same meaning as in ordinary language? What criterion can be used to determine whether the data depicted in a histogram have a distribution that is approximately a normal distribution? Is this criterion totally objective, or does it involve subjective judgment?
Read more -
Chapter 2: Problem 5 Elementary Statistics 12
Interpreting a Histogram. In Exercises 58, answer the questions by referring to the following Minitabgenerated histogram, which represents the heights (inches) of people randomly selected from those who entered New York City's Museum of Natural History during a recent Friday morning.Sample Size What is the approximate number of people with heights of 55 in. or less?
Read more -
Chapter 2: Problem 6 Elementary Statistics 12
Interpreting a Histogram. In Exercises 58, answer the questions by referring to the following Minitabgenerated histogram, which represents the heights (inches) of people randomly selected from those who entered New York City's Museum of Natural History during a recent Friday morning.Class Width and Class Limits What is the class width? What are the approximate lower and upper class limits of the first class?
Read more -
Chapter 2: Problem 7 Elementary Statistics 12
Interpreting a Histogram. In Exercises 58, answer the questions by referring to the following Minitabgenerated histogram, which represents the heights (inches) of people randomly selected from those who entered New York City's Museum of Natural History during a recent Friday morning.. Outlier? What is the height of the tallest person included in the histogram? Where on the histogram is that height depicted? Is that height an outlier? Could that height be an exceptional value that is correct, or is it an error? Explain.
Read more -
Chapter 2: Problem 8 Elementary Statistics 12
Interpreting a Histogram. In Exercises 58, answer the questions by referring to the following Minitabgenerated histogram, which represents the heights (inches) of people randomly selected from those who entered New York City's Museum of Natural History during a recent Friday morning.Gap What is a reasonable explanation for the gap between the group of people with heights between 43 in. and 55 in., and the group of people with heights between 57 in. and 77 in.?
Read more -
Chapter 2: Problem 9 Elementary Statistics 12
Constructing Histograms. In Exercises 918, construct the histograms and answer the given questions. Analysis of Last Digits Use the frequency distribution from Exercise 19 in Section 22 to construct a histogram. What can you conclude from the distribution of the digits? Specifically, do the heights appear to be reported or actually measured?
Read more -
Chapter 2: Problem 10 Elementary Statistics 12
Constructing Histograms. In Exercises 918, construct the histograms and answer the given questions.Analysis of Last Digits Use the frequency distribution from Exercise 20 in Section 22 to construct a histogram. What can you conclude from the distribution of the digits? Specifically, do the weights appear to be reported or actually measured?
Read more -
Chapter 2: Problem 11 Elementary Statistics 12
Constructing Histograms. In Exercises 918, construct the histograms and answer the given questions.Pulse Rates of Males Use the frequency distribution from Exercise 21 in Section 22 to construct a histogram. Does the histogram appear to depict data that have a normal distribution? Why or why not?
Read more -
Chapter 2: Problem 12 Elementary Statistics 12
Constructing Histograms. In Exercises 918, construct the histograms and answer the given questions.Pulse Rates of Females Use the frequency distribution from Exercise 22 in Section 22 to construct a histogram. Does the histogram appear to depict data that have a normal distribution? Why or why not?
Read more -
Chapter 2: Problem 13 Elementary Statistics 12
Constructing Histograms. In Exercises 918, construct the histograms and answer the given questions.Earthquake Magnitudes Use the frequency distribution from Exercise 23 in Section 22 to construct a histogram. Using a loose interpretation of the requirements for a normal distribution, do the magnitudes appear to be normally distributed? Why or why not?
Read more -
Chapter 2: Problem 14 Elementary Statistics 12
Constructing Histograms. In Exercises 918, construct the histograms and answer the given questions.Earthquake Depths Use the frequency distribution from Exercise 24 in Section 22 to construct a histogram. Using a strict interpretation of the requirements for a normal distribution, do the depths appear to be normally distributed? Why or why not?
Read more -
Chapter 2: Problem 15 Elementary Statistics 12
Constructing Histograms. In Exercises 918, construct the histograms and answer the given questions.. Male Red Blood Cell Counts Use the frequency distribution from Exercise 25 in Section 22 to construct a histogram. Using a very loose interpretation of the requirements for a normal distribution, do the red blood cell counts appear to be normally distributed? Why or why not?
Read more -
Chapter 2: Problem 16 Elementary Statistics 12
Constructing Histograms. In Exercises 918, construct the histograms and answer the given questions.Female Red Blood Cell Counts Use the frequency distribution from Exercise 26 in Section 22 to construct a histogram. Using a very loose interpretation of the requirements for a normal distribution, do the red blood cell counts appear to be normally distributed? Why or why not?
Read more -
Chapter 2: Problem 17 Elementary Statistics 12
Constructing Histograms. In Exercises 918, construct the histograms and answer the given questions.Flight Arrival Times Use the frequency distribution from Exercise 27 in Section 22 to construct a histogram. Which part of the histogram depicts flights that arrived early, and which part depicts flights that arrived late?
Read more -
Chapter 2: Problem 18 Elementary Statistics 12
Constructing Histograms. In Exercises 918, construct the histograms and answer the given questions.Flight TaxiOut Times Use the relative frequency distribution from Exercise 28 in Section 22 to construct a histogram. If the quality of air traffic procedures were improved so that the taxiout times vary much less, would the histogram be affected?
Read more -
Chapter 2: Problem 19 Elementary Statistics 12
BacktoBack Relative Frequency Histograms When using histograms to compare two data sets, it is sometimes difficult to make comparisons by looking back and forth between the two histograms. A backtoback relative frequency histogram has a format that makes the comparison much easier. Instead of frequencies, we should use relative frequencies (percentages or proportions) so that the comparisons are not difficult when there are different sample sizes. Use the relative frequency distributions of the ages of Oscarwinning actresses and actors from Exercise 15 in Section 22, and complete the backtoback relative frequency histograms shown below. Then use the result to compare the two data sets.
Read more -
Chapter 2: Problem 20 Elementary Statistics 12
Interpreting a Histogram Refer to the histogram given for Exercises 58 and answer the following questions: a. What are the possible values (rounded to the nearest inch) of the largest height included in the histogram? What are those values expressed in feet and inches? b. Why is it wrong to say that the people with heights between 43 in. and 55 in. are the tallest people because they have the tallest bars in the histogram?
Read more